Creating an Interactive NYC Restaurant Week 2026 Map: Web Scraping with Selenium, Populating Addresses with Google Places API, Geocoding with Google Geocoding API, and Mapping with React
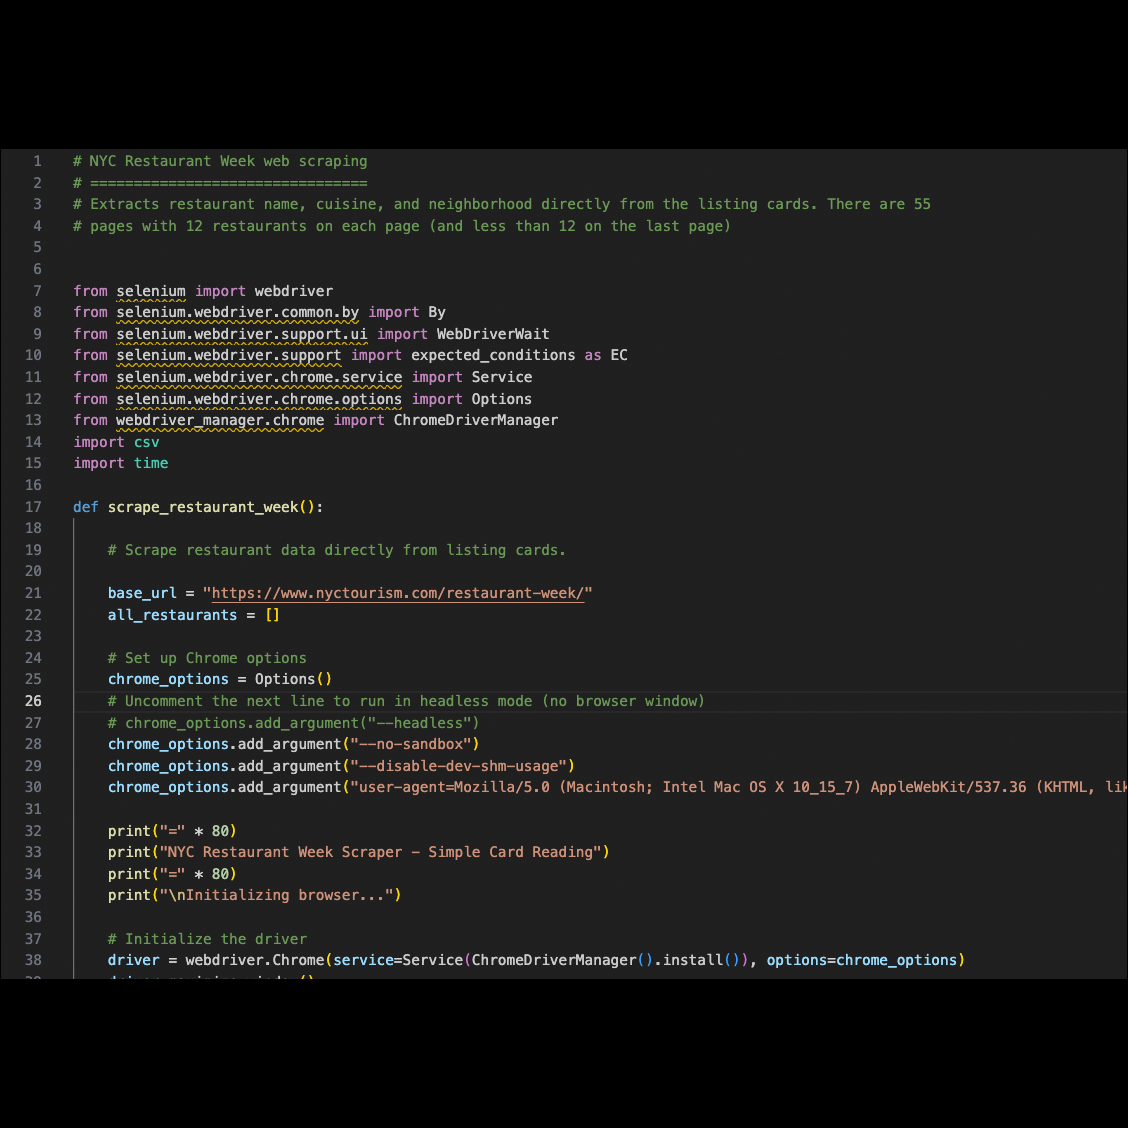
The Selenium code that scraped the restaurant name, cuisine, and neighborhood from the website
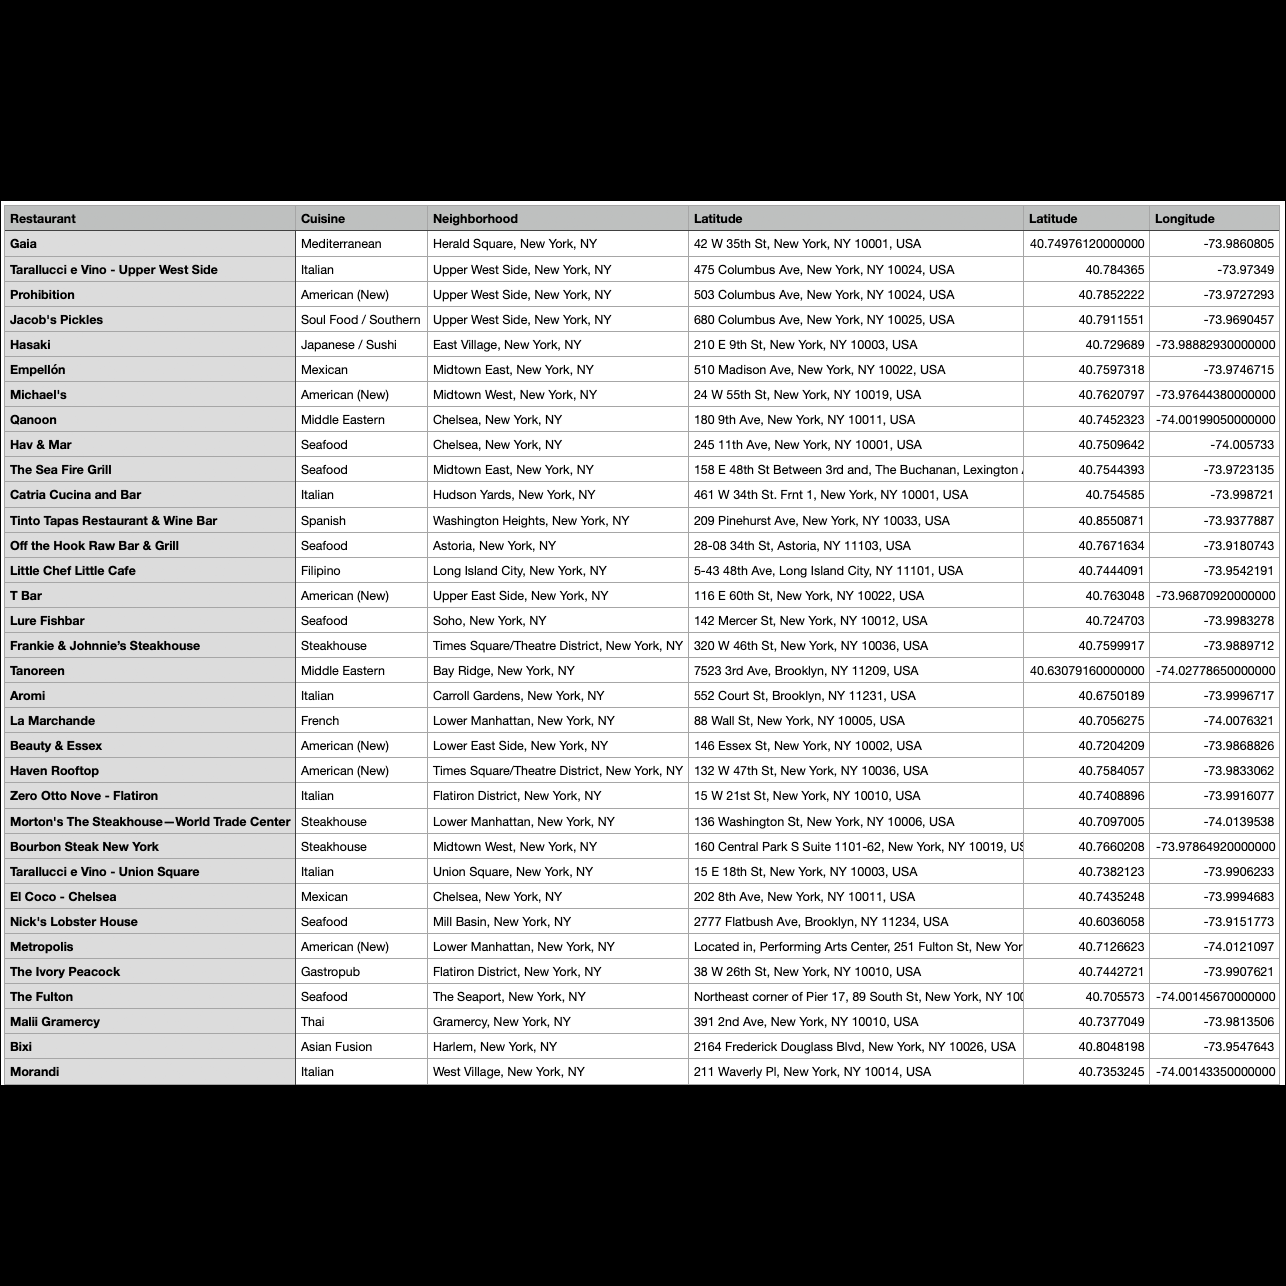
Updated csv file after geocoding the restaurant locations via Google Geocoding API
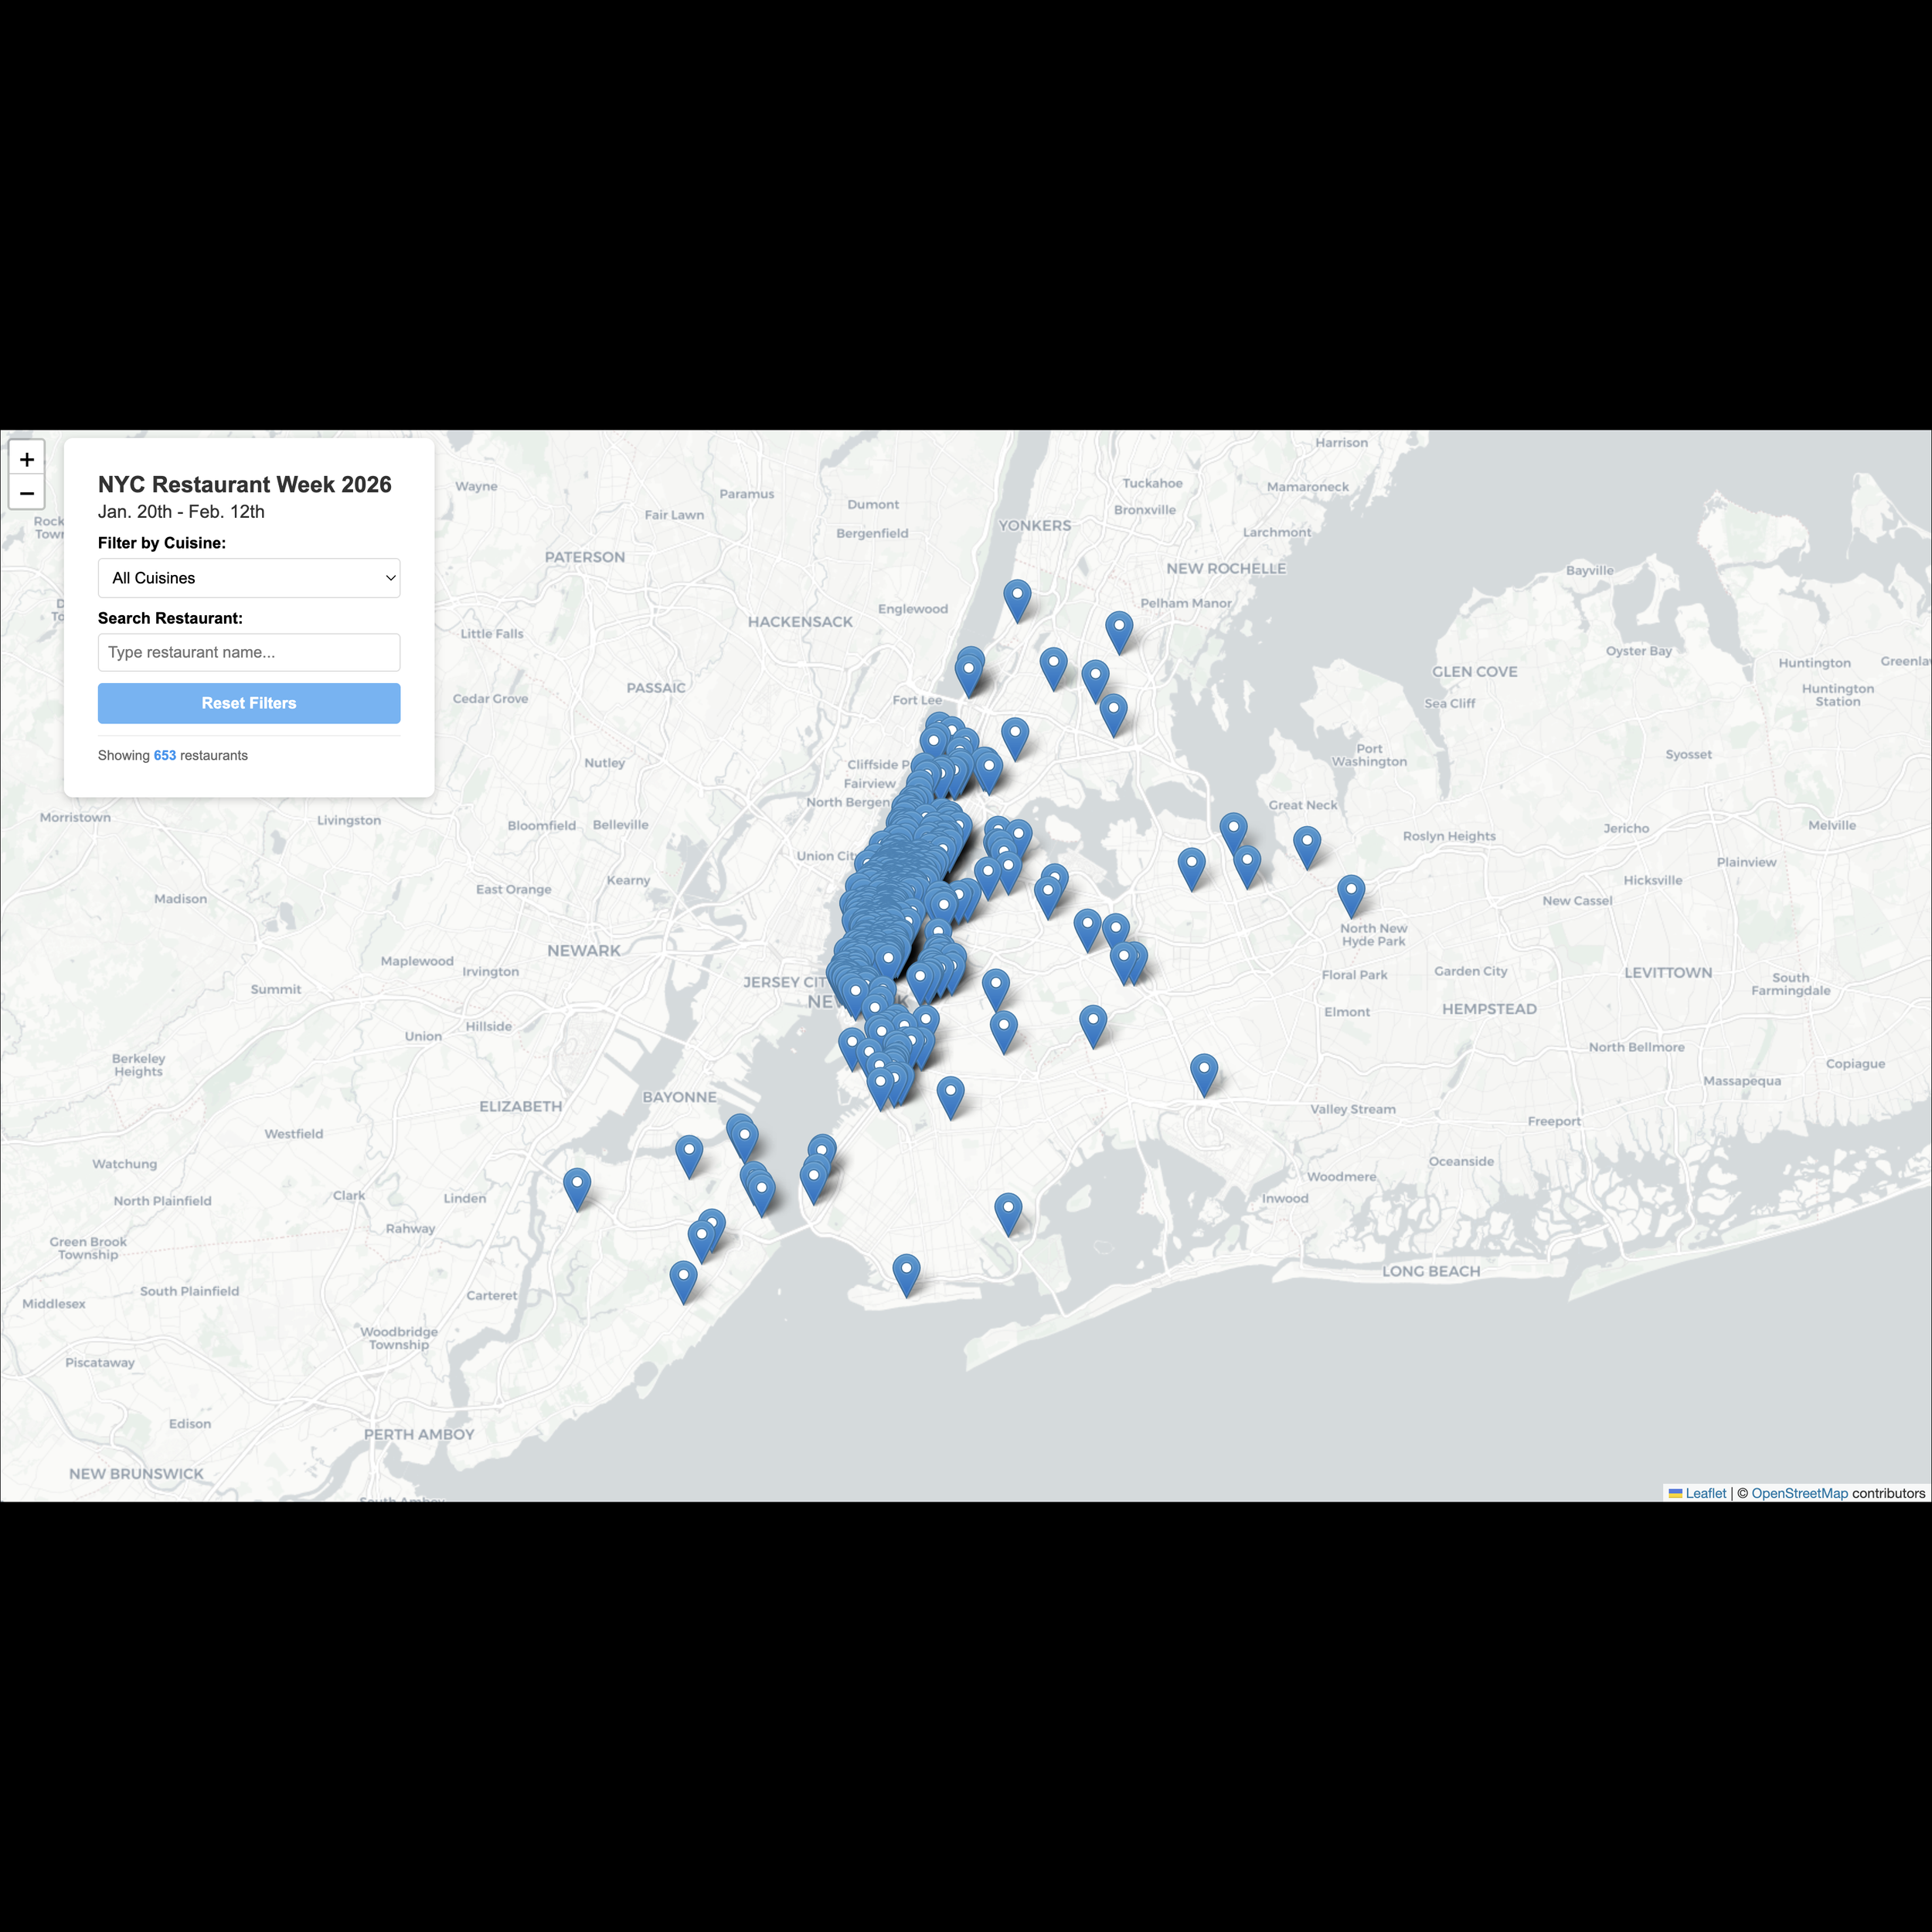
Desktop version of map created using React
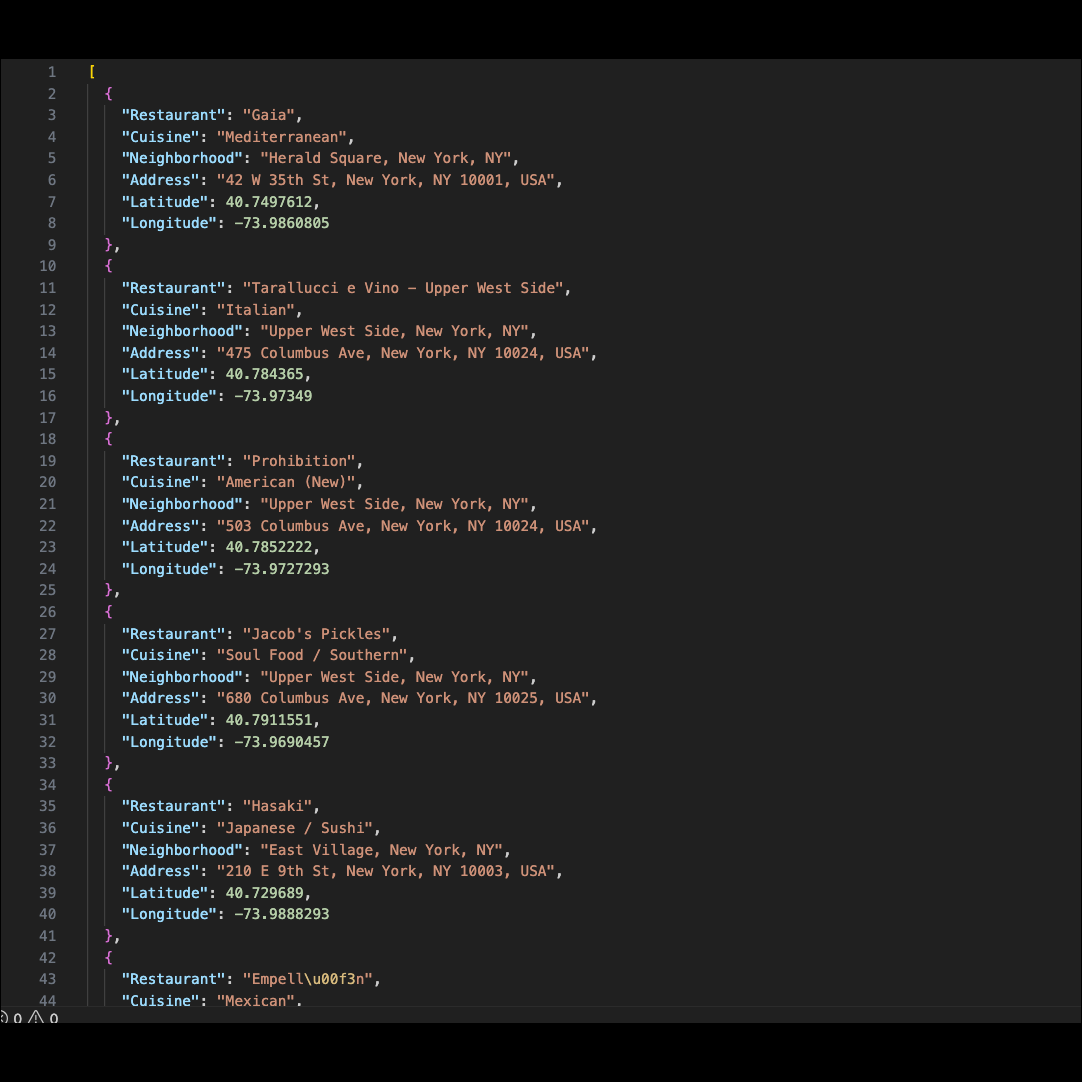
Converted csv to json to create the map
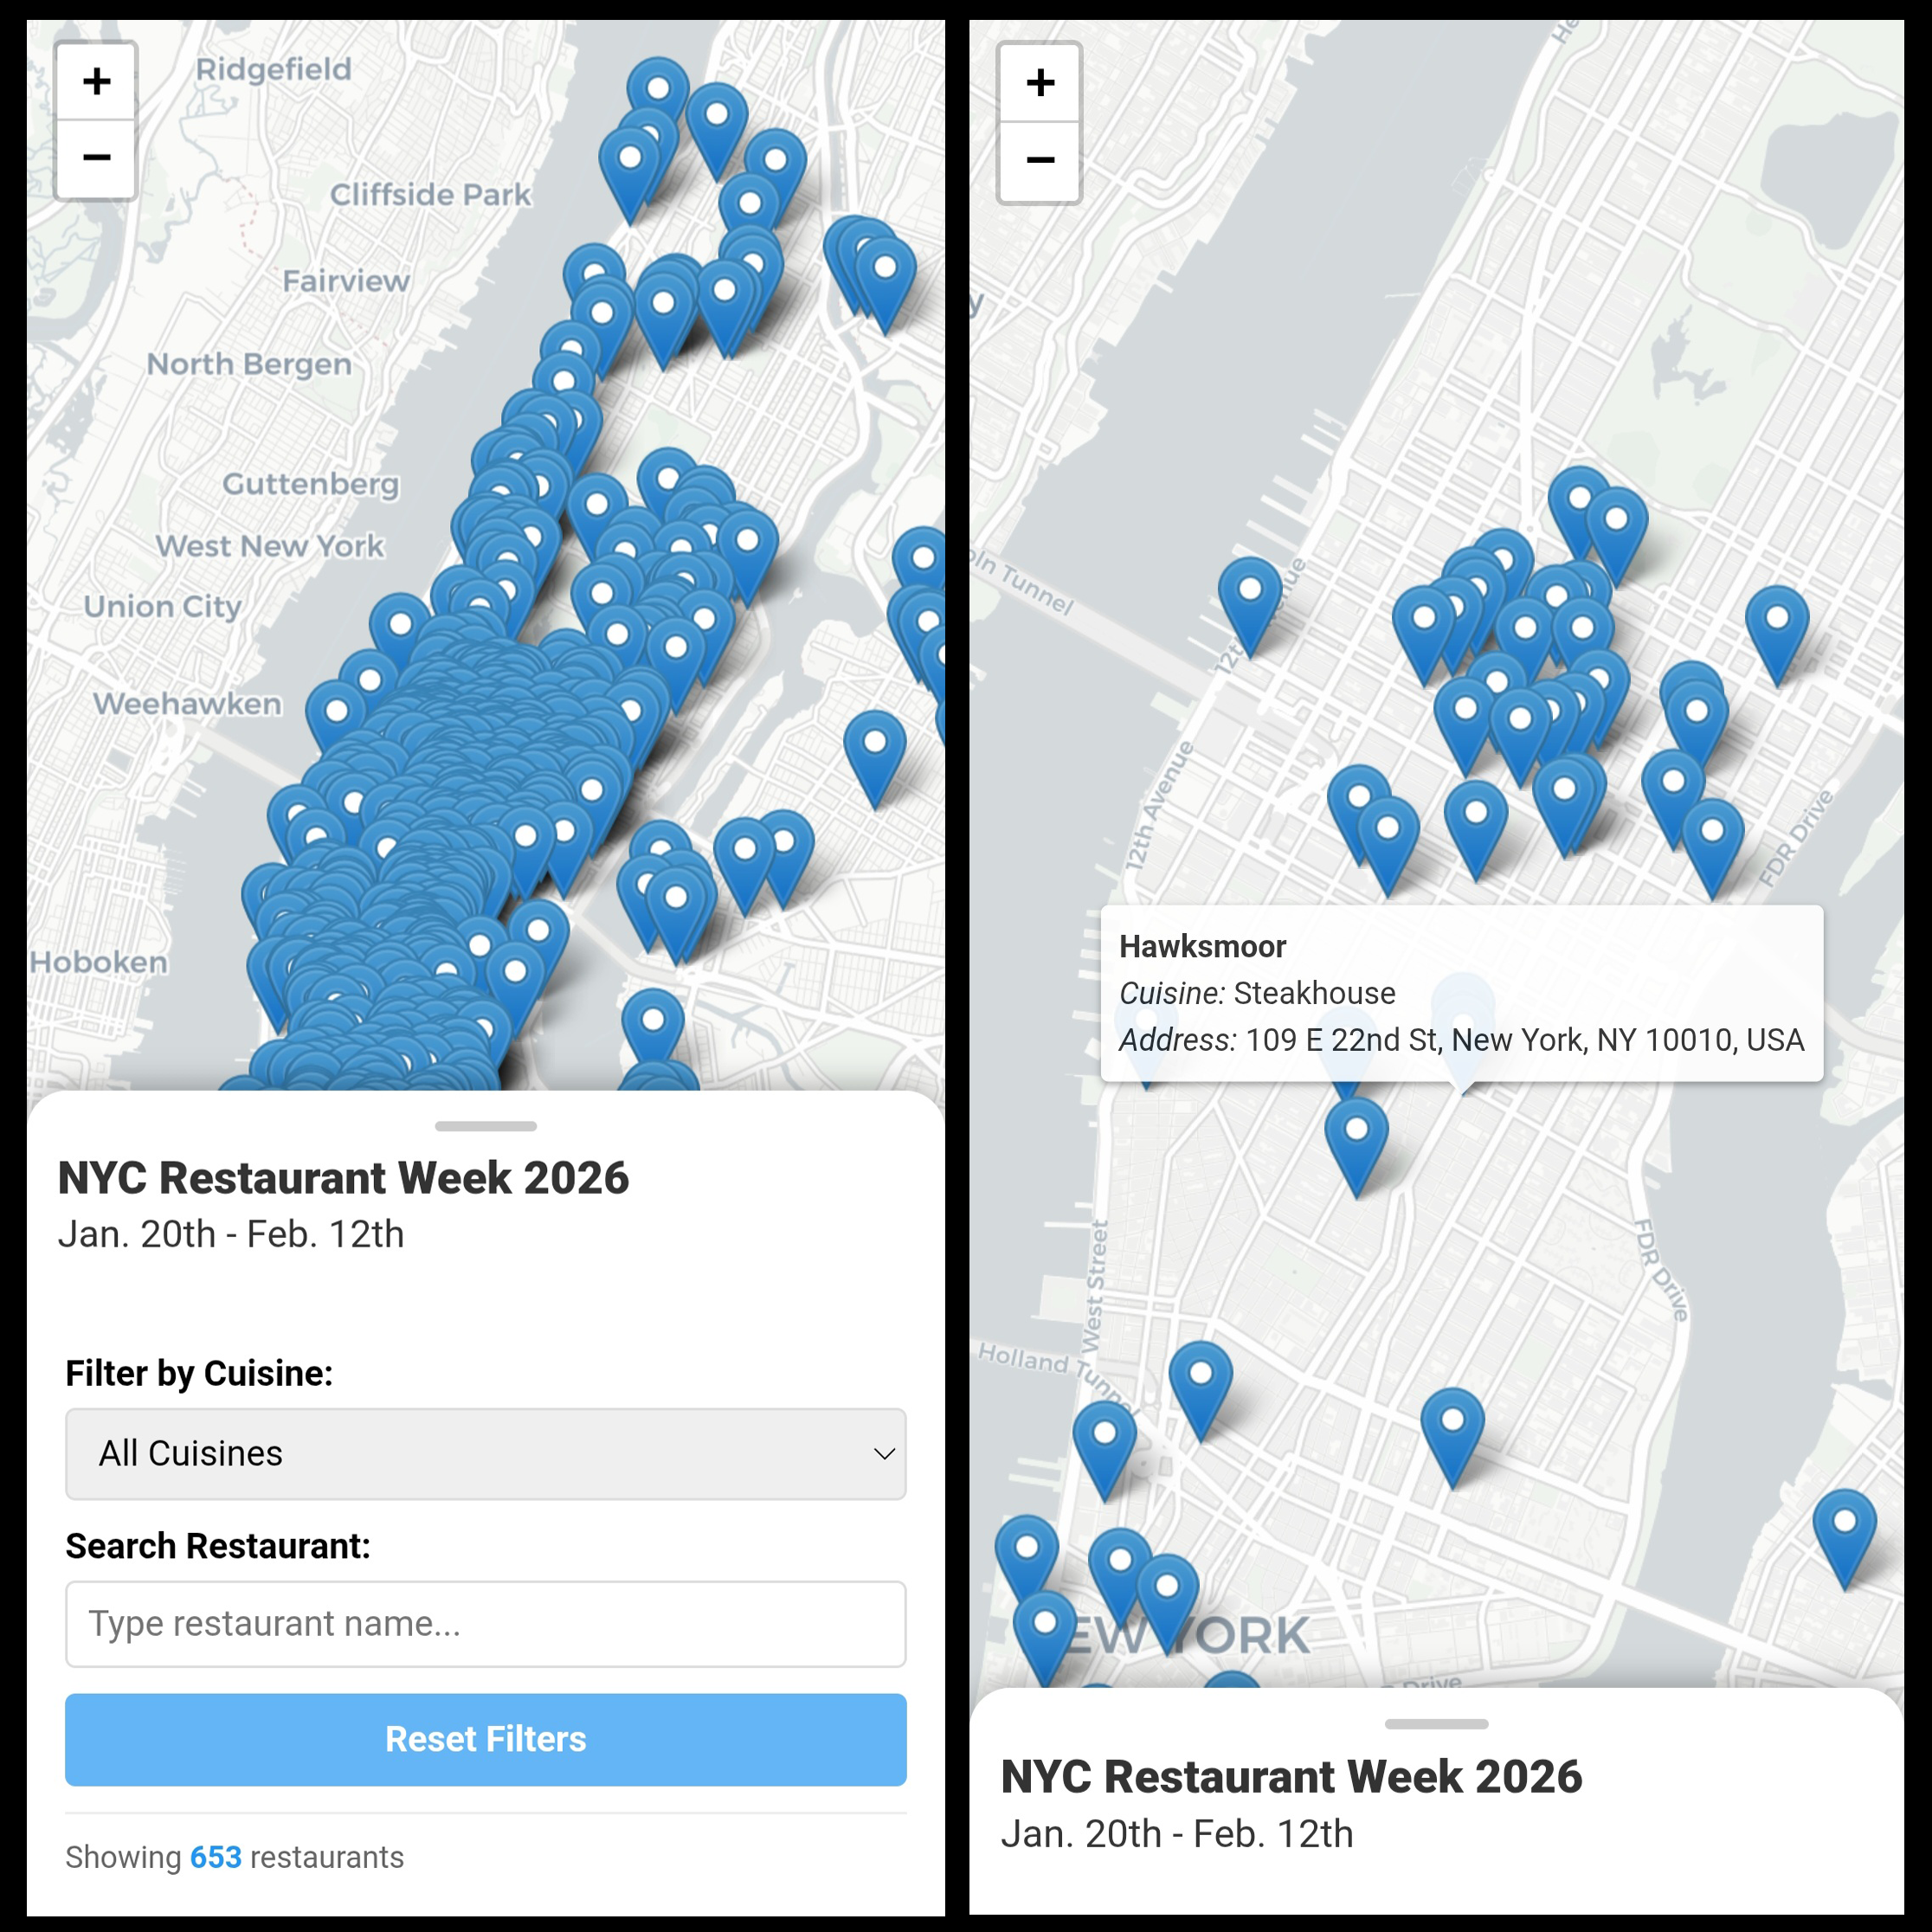
Mobile version
(For the GitHub repository, please click here, and for the interactive map, please click here.)
Executive Summary
NYC Restaurant Week occurs twice a year, once in winter and again in late summer. For this year’s winter 2026 session from Jan. 20th-Feb. 12th, I noticed that their website, https://www.nyctourism.com/restaurant-week/, lists the 653 participating restaurants across 55 pages with filtering options, but that there’s no map available.
As someone who loves maps and making them, I decided I’d give it a go!
Tools Used
Selenium to web scrape
Google Places API
Google Geocoding API
React to create an interactive map
Method
At first, I tried to scrape all the relevant data - including restaurant name, description, and address - by clicking into each restaurant’s individual page on the website. However, the structure of the website proved challenging. 653 restaurants are displayed across 55 pages, with 12 hyperlinked cards on each page (except the last page, which has 5 on it). So while I could get the restaurant name, cuisine type, and neighborhood easily from the 12 cards on the same page, if I wanted the actual description of the restaurant and its address, you had to click into the card and get to a separate page just for that restaurant.
Once there, you couldn’t easily return to the previous page with the 12 restaurants just by clicking on the back arrow, and there was no forward arrow to navigate to the next of the 12 restaurants. To leave the page, you had to scroll to the top of the page, and click “Restaurant Week,” which took you back to the website’s first page. So if you were on the 2nd, 3rd, 4th, or any page through the 55th, once you were back on that very first page, you’d then have to navigate back to whatever page you’d been on last to retrieve more restaurant data.
There were also timeout issues since information loads dynamically via lazy scrolling.
Because it was too circuitous, finally, I designed my pipeline to:
1) First, have Selenium scrape the restaurant name, cuisine type, and neighborhood from the 12 cards on each of the main 54 pages and 5 cards on the 55th (last) page - instead of clicking into anything - and compile everything into a csv file.
2) Then, it stops so that you can manually review the csv file. (This is because I noticed that 3 restaurants had neighborhood info for Cuisine because on the website, that’s what data had been inserted into that html section. So I did have to manually enter the info for those 3 restaurants.)
3) When you’re ready, you hit Enter to continue.
4) Then, it appends each entry in the “Neighborhood” column with “, New York, NY”, so that it’d say “Brooklyn Heights, New York, NY”, “Soho, New York, NY”, etc.
5) Then, it makes a Google Places API call to add the actual addresses of the restaurants.
6) Then, it makes a Google Geocoding API call to convert the addresses into latitude and longitude and add those new columns.
7) Then, it converts the csv file to json.
8) Finally, it creates the interactive map with React and Leaflet.
The map features a filter option via cuisine type, a search bar for restaurant names, and hover tooltip functionality showing each restaurant’s name, cuisine type, and address. Please enjoy the map here: https://princessbari.github.io/nyc_restaurant_week_2026_interactive_map_using_react/.