Creating an Interactive NYC Live MTA Bus Tracker: Reverse Engineering the MTA Bus Time API's Route Naming Convention, Fetching and Processing Live Bus Data with AWS Lambda, and Mapping with Mapbox GL JS
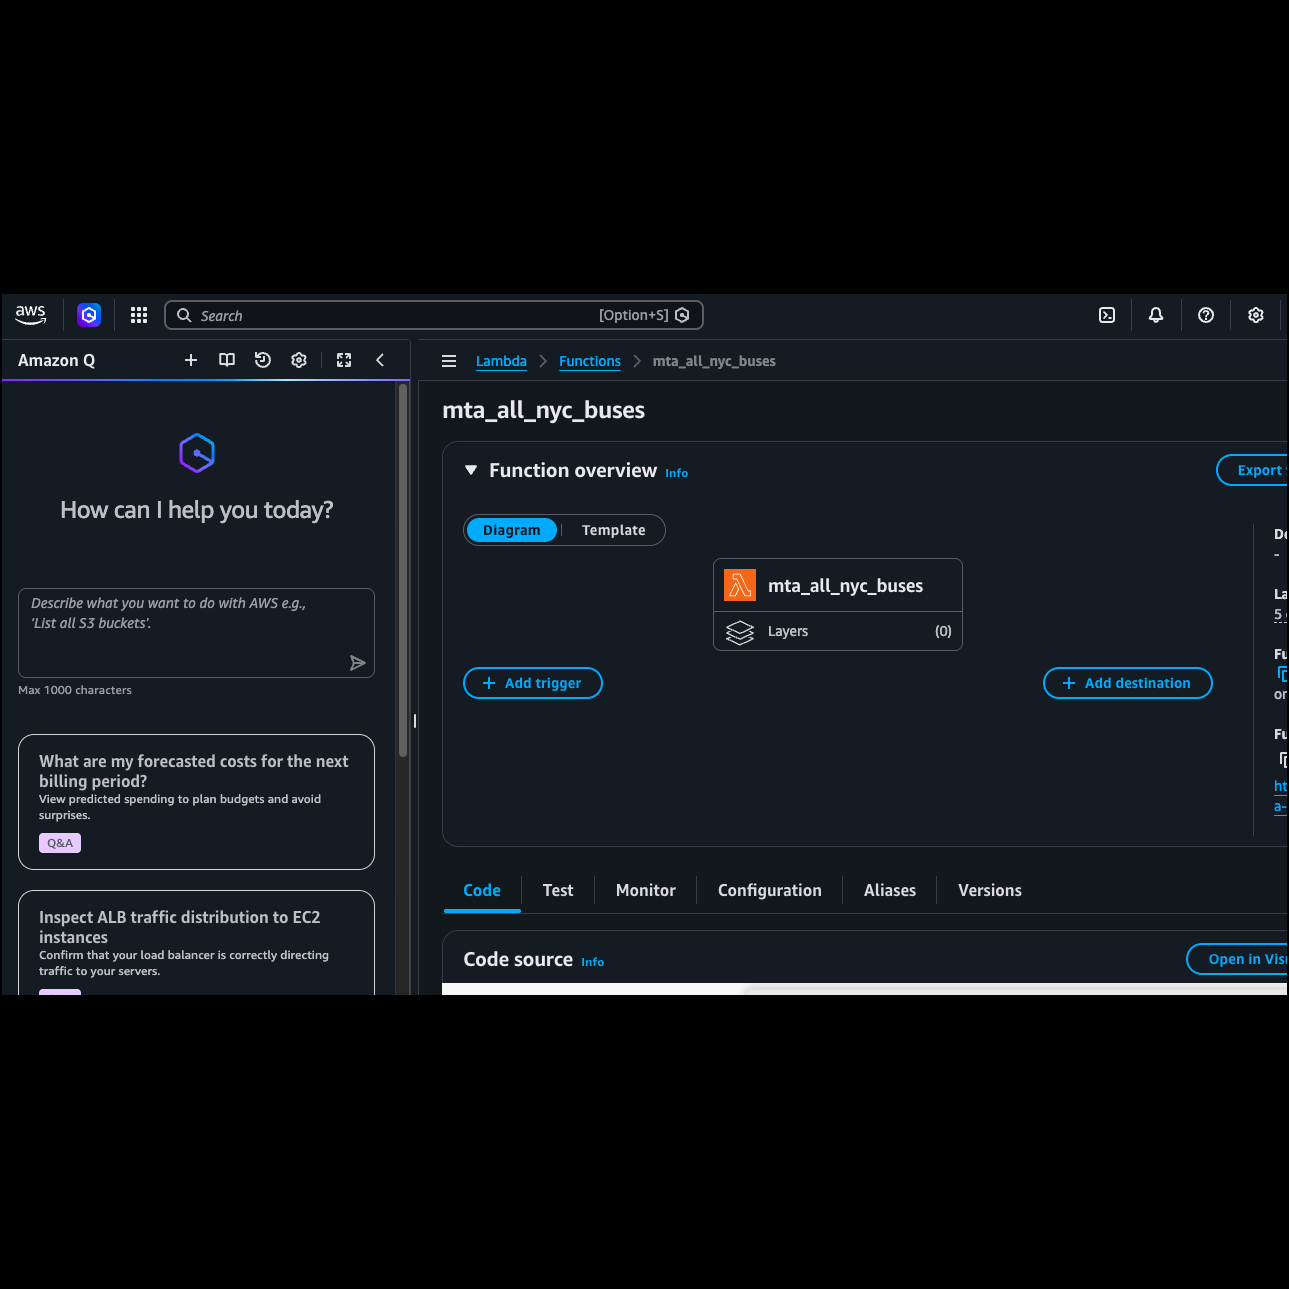
AWS Lambda function console where the Python code is deployed and triggered every time the map requests live bus data
Desktop view on initial load and after hovering over a QM2 bus
Desktop view showing the B1 route path and highlighted buses after selecting B1 from the Brooklyn dropdown

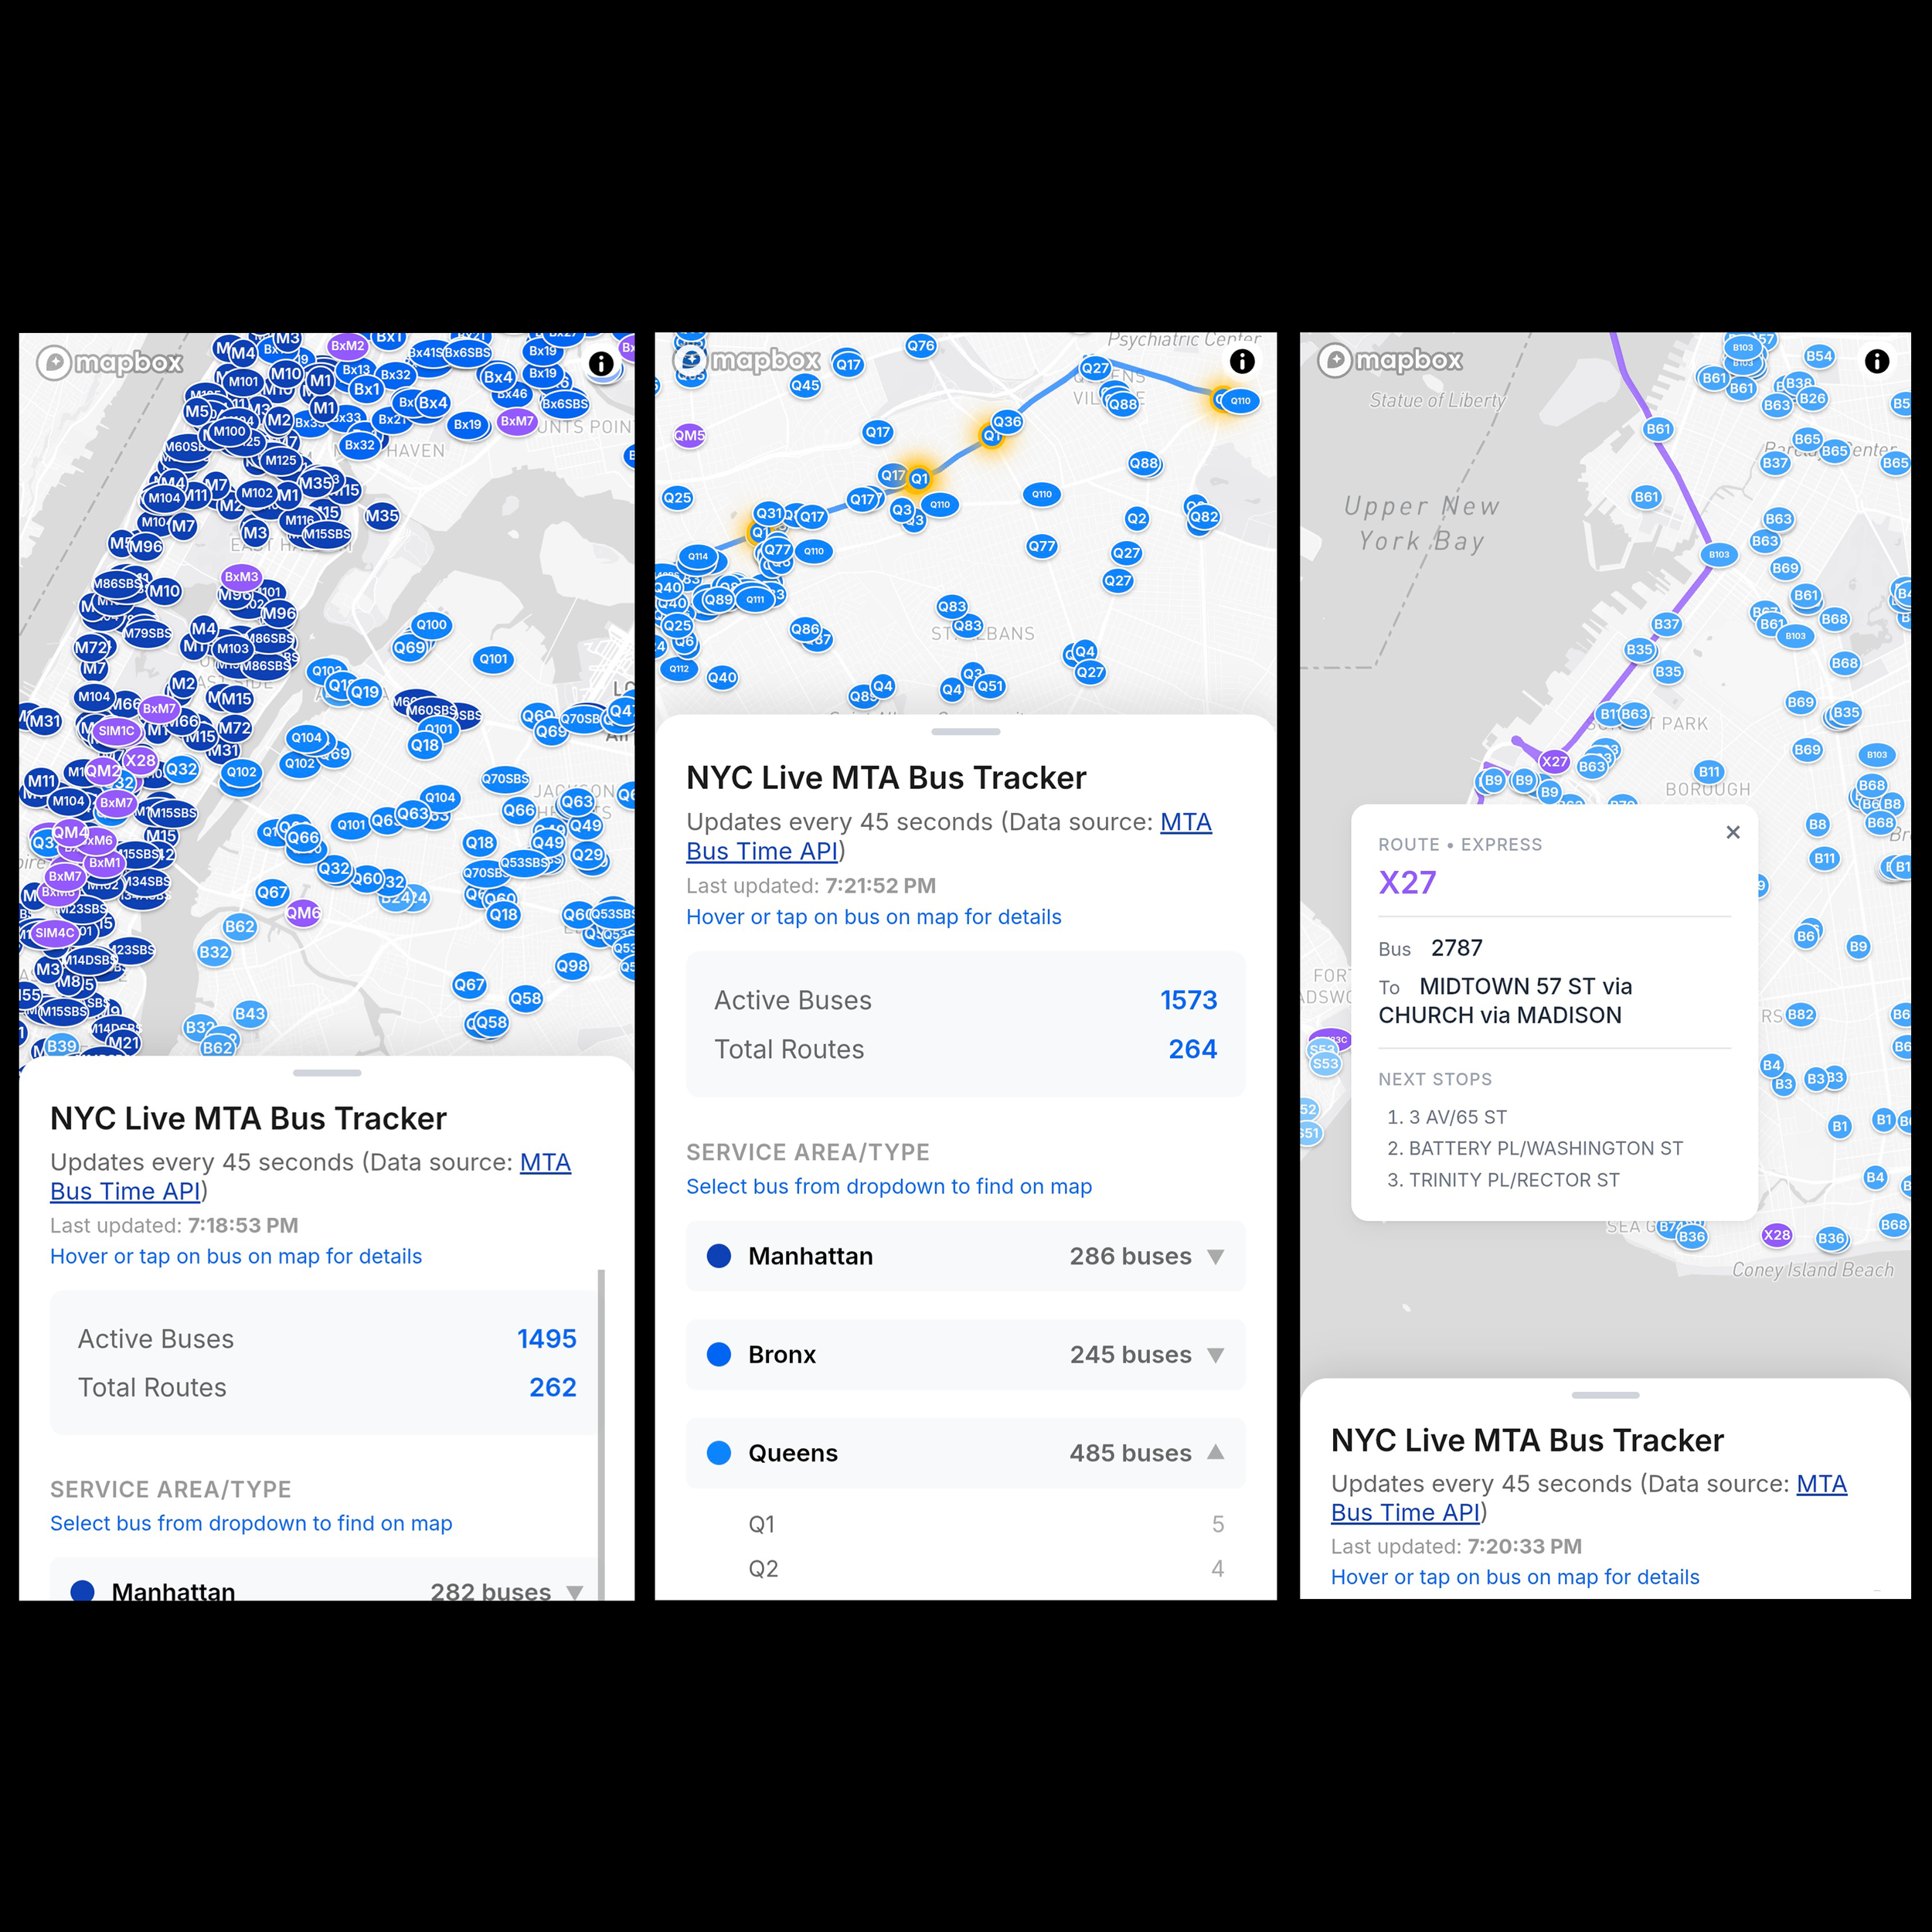
Mobile page on initial load, after selecting the Q1 route from the Queens dropdown, and after tapping on an X27 bus and minimizing the info panel
(For the GitHub repository, please click here, and for the interactive map, please click here.)
Summary
As an NYC resident and avid MTA bus rider, while I appreciate the MTA app, I wish it would actually visualize your bus options. Instead of showing them on their map, you have to pull up an info panel that just lists nearby routes. That’s why I decided to create this interactive map: to be able to see every single MTA bus currently in service across the city.
This map makes an API call to the MTA Bus Time API every 45 seconds. When a user hovers (desktop) or taps (mobile) on a bus, a popup appears showing the bus number, destination, and next few stops — along with the full route path and bus stop locations on the map. Users can also select a route from the borough and express dropdowns, which highlights all buses on that route and displays the full route path.
The frontend is hosted on GitHub Pages, while the backend lives in an AWS Lambda function. Every 45 seconds, the browser makes a direct API call to the Lambda URL, which fetches the latest bus data from the MTA Bus Time API and returns it to the map.
Considerable time was spent reverse engineering the MTA Bus Time API's route naming convention. This is because the API returns a PublishedLineName field that's sometimes a string and sometimes a list, so I first had to normalize that inconsistency before parsing the route name.
NYC bus routes follow a prefix-based system that encodes both borough and service type. I learned that express routes get their own category regardless of borough, and the prefixes are “BXM” (Bronx express), “QM” (Queens express), “BM” (Brooklyn express), “SIM” (Staten Island express), and “X” (a general express prefix that’s apparently a legacy naming convention). For local routes, a single or double letter prefix indicates the borough: “M” for Manhattan, “B” for Brooklyn, “Q” for Queens, “S” for Staten Island, and “BX” for the Bronx.
In order to add the route shapes and bus stop locations to the map, I downloaded static GTFS (General Transit Feed Specification) data from the MTA, from six different folders. Five folders exist for each borough route, and then the sixth contains the express bus info in the MTA Bus Company folder. Each folder contains various txt files.
To create the route shapes, convert_gtfs.py uses the trips.txt and shapes.txt files. Trips.txt maps each shape_id to a route_id, while shapes.txt contains the ordered sequences of latitude/longitude coordinates that define the physical path of every route. The script groups these coordinate sequences by route and outputs them as a MultiLineString GeoJSON, which Mapbox uses to draw the route path on the map.
To create the bus stops layer, convert_stops.py chains together three files. Trips.txt maps each trip_id to a route_id. Stop_times.txt maps each trip_id to the stop_ids it visits. And stops.txt provides the name and latitude/longitude coordinates for each stop. By linking all three together, the script can determine which stops belong to which route and outputs them as a Point GeoJSON, which Mapbox uses to draw the bus stop location circles along the route.
The most complex part of this process was ensuring route ID normalization was consistent across both scripts — the MTA's GTFS data uses inconsistent formatting such as agency prefixes (e.g. “MTA NYCT_M15”), leading zeros (e.g. “Q06” instead of “Q6”), and special characters (e.g. “M23+” for SBS routes) that had to be cleaned and standardized before the stop and shape data could be correctly matched to their routes.
Tools Used
Python
JavaScript / HTML / CSS
Mapbox GL JS
MTA Bus Time API
AWS Lambda
GTFS Data (converted to GeoJSON via Python)
GitHub Pages