Creating an Interactive Sheet Music Sales Dashboard: Automating ArrangeMe Sales Report Downloads with Playwright; Cleaning and Enriching Transaction Data with pandas; and Visualizing Sales, Commissions, and Purchase Locations with Streamlit and Plotly
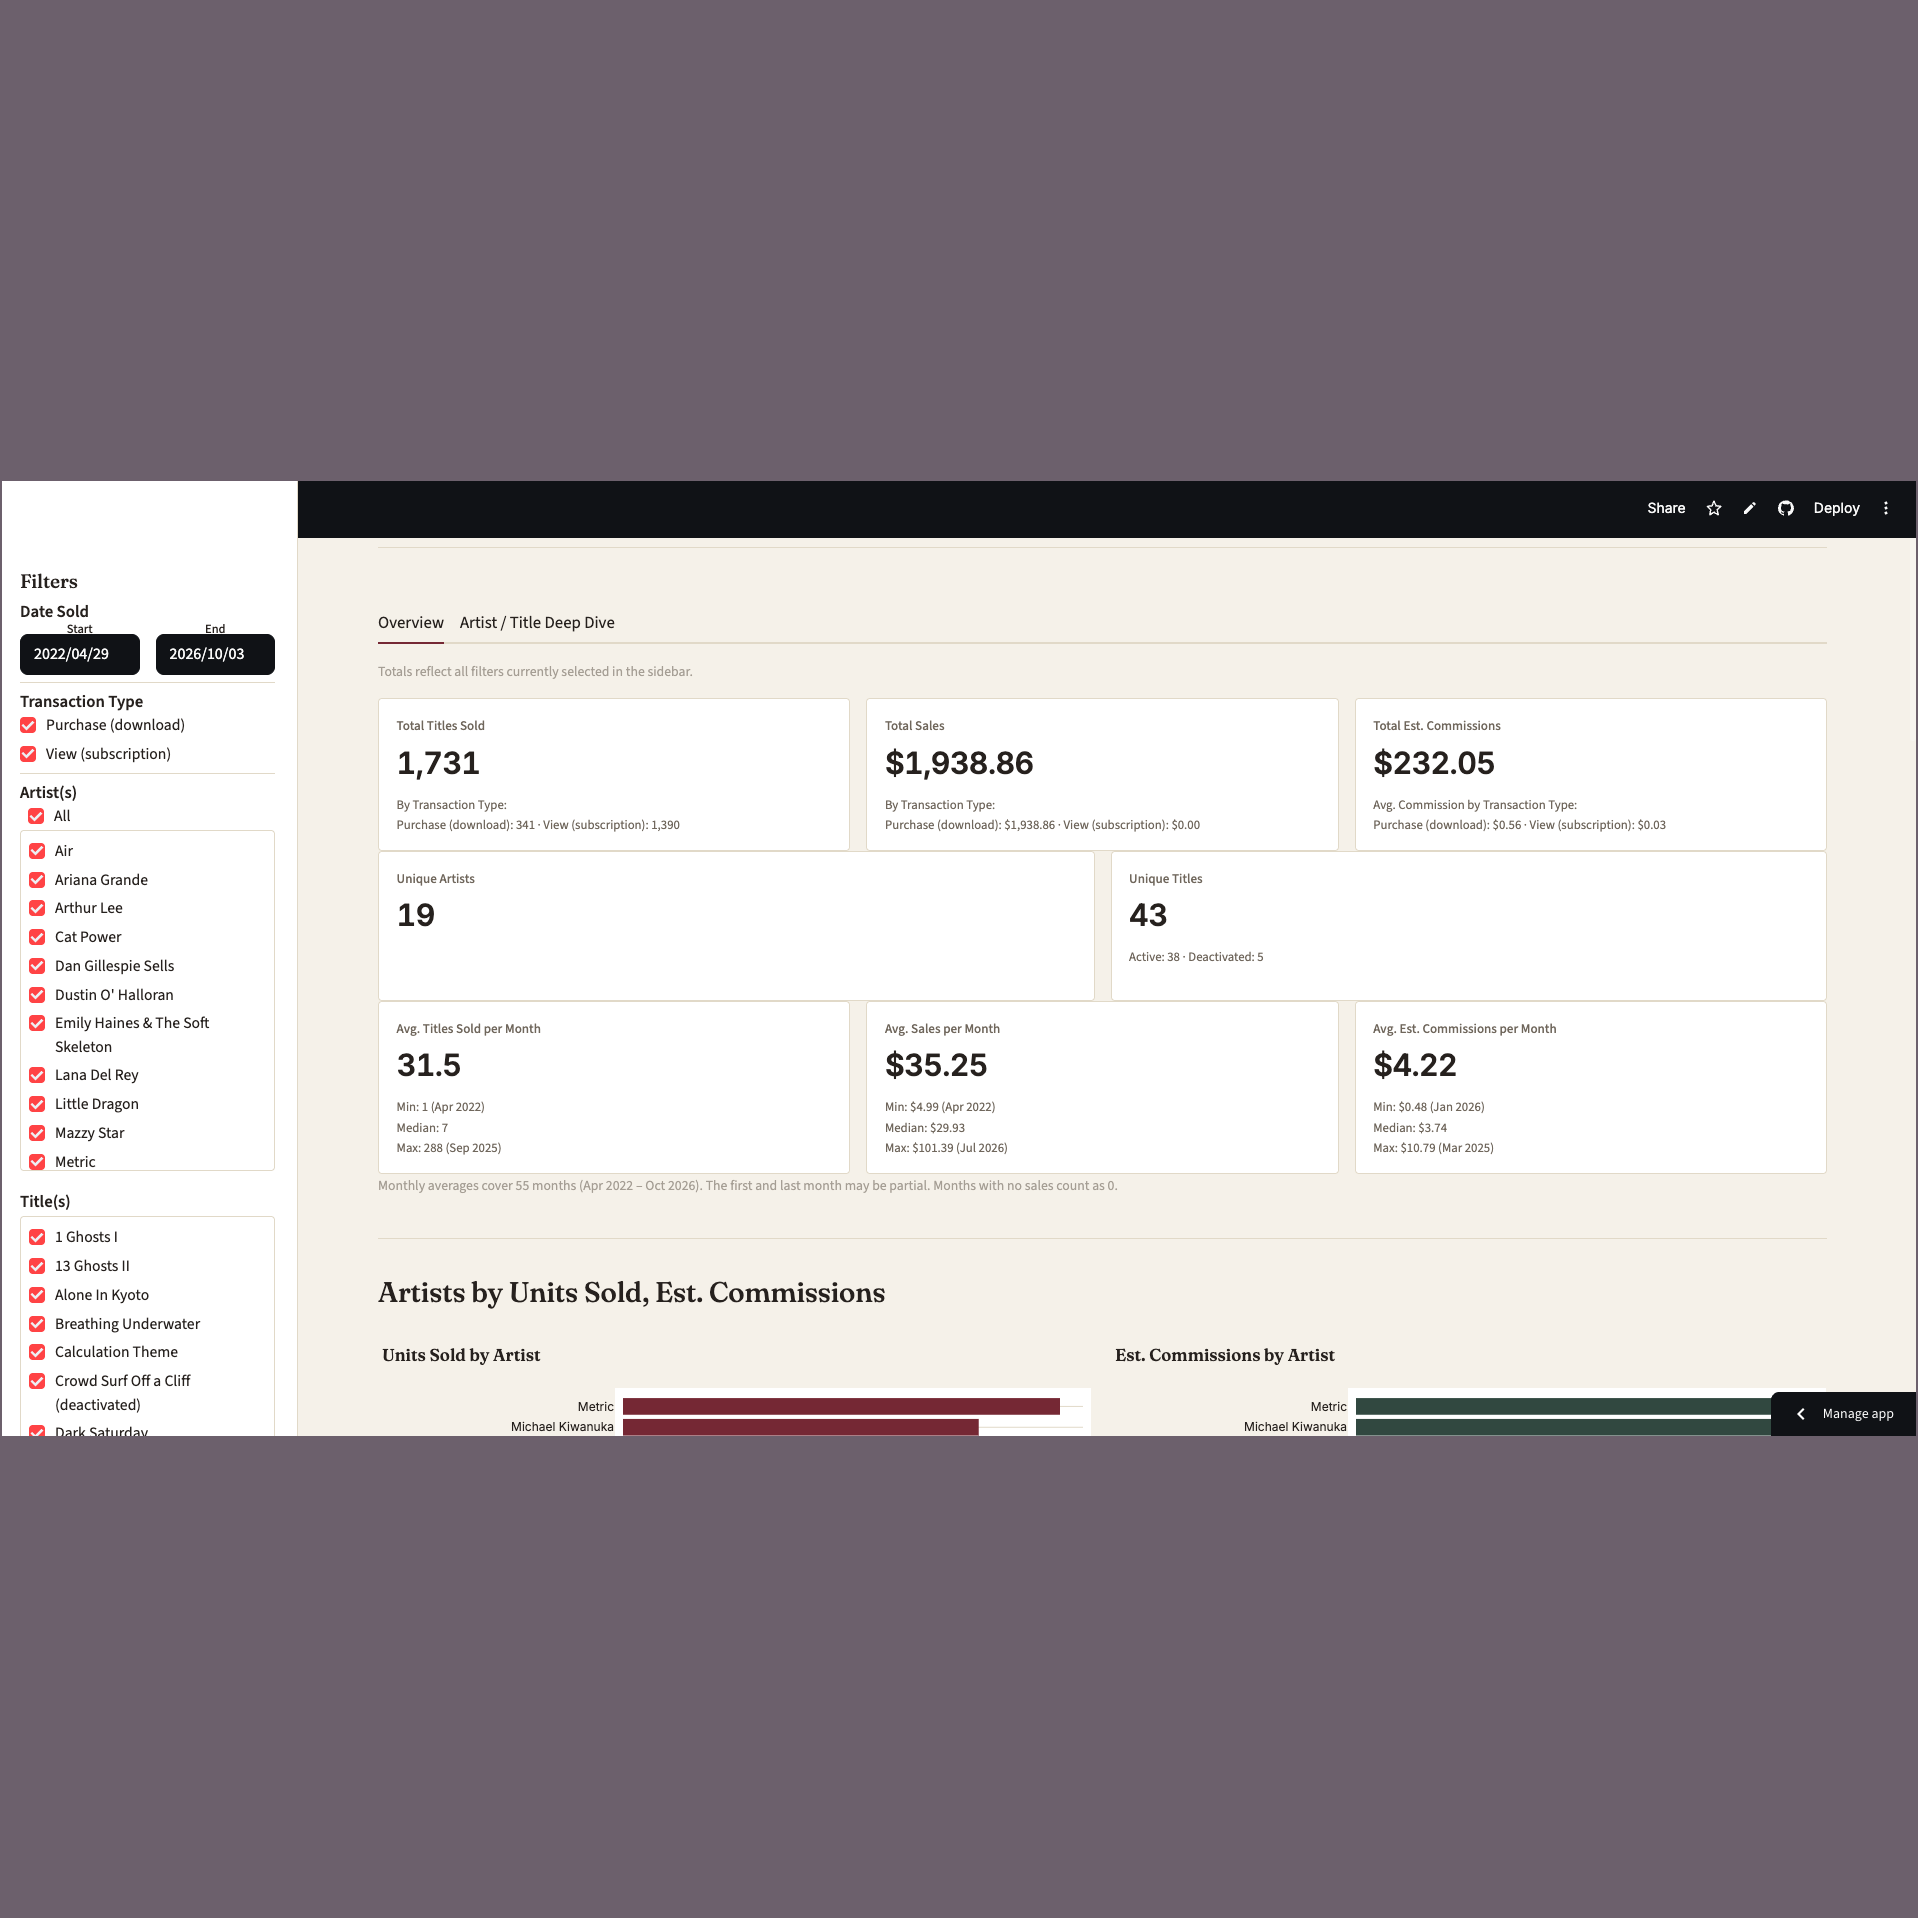
The main overview page with Date Sold, Transaction Type, Artist(s), and Title(s) filters and KPI cards at the top
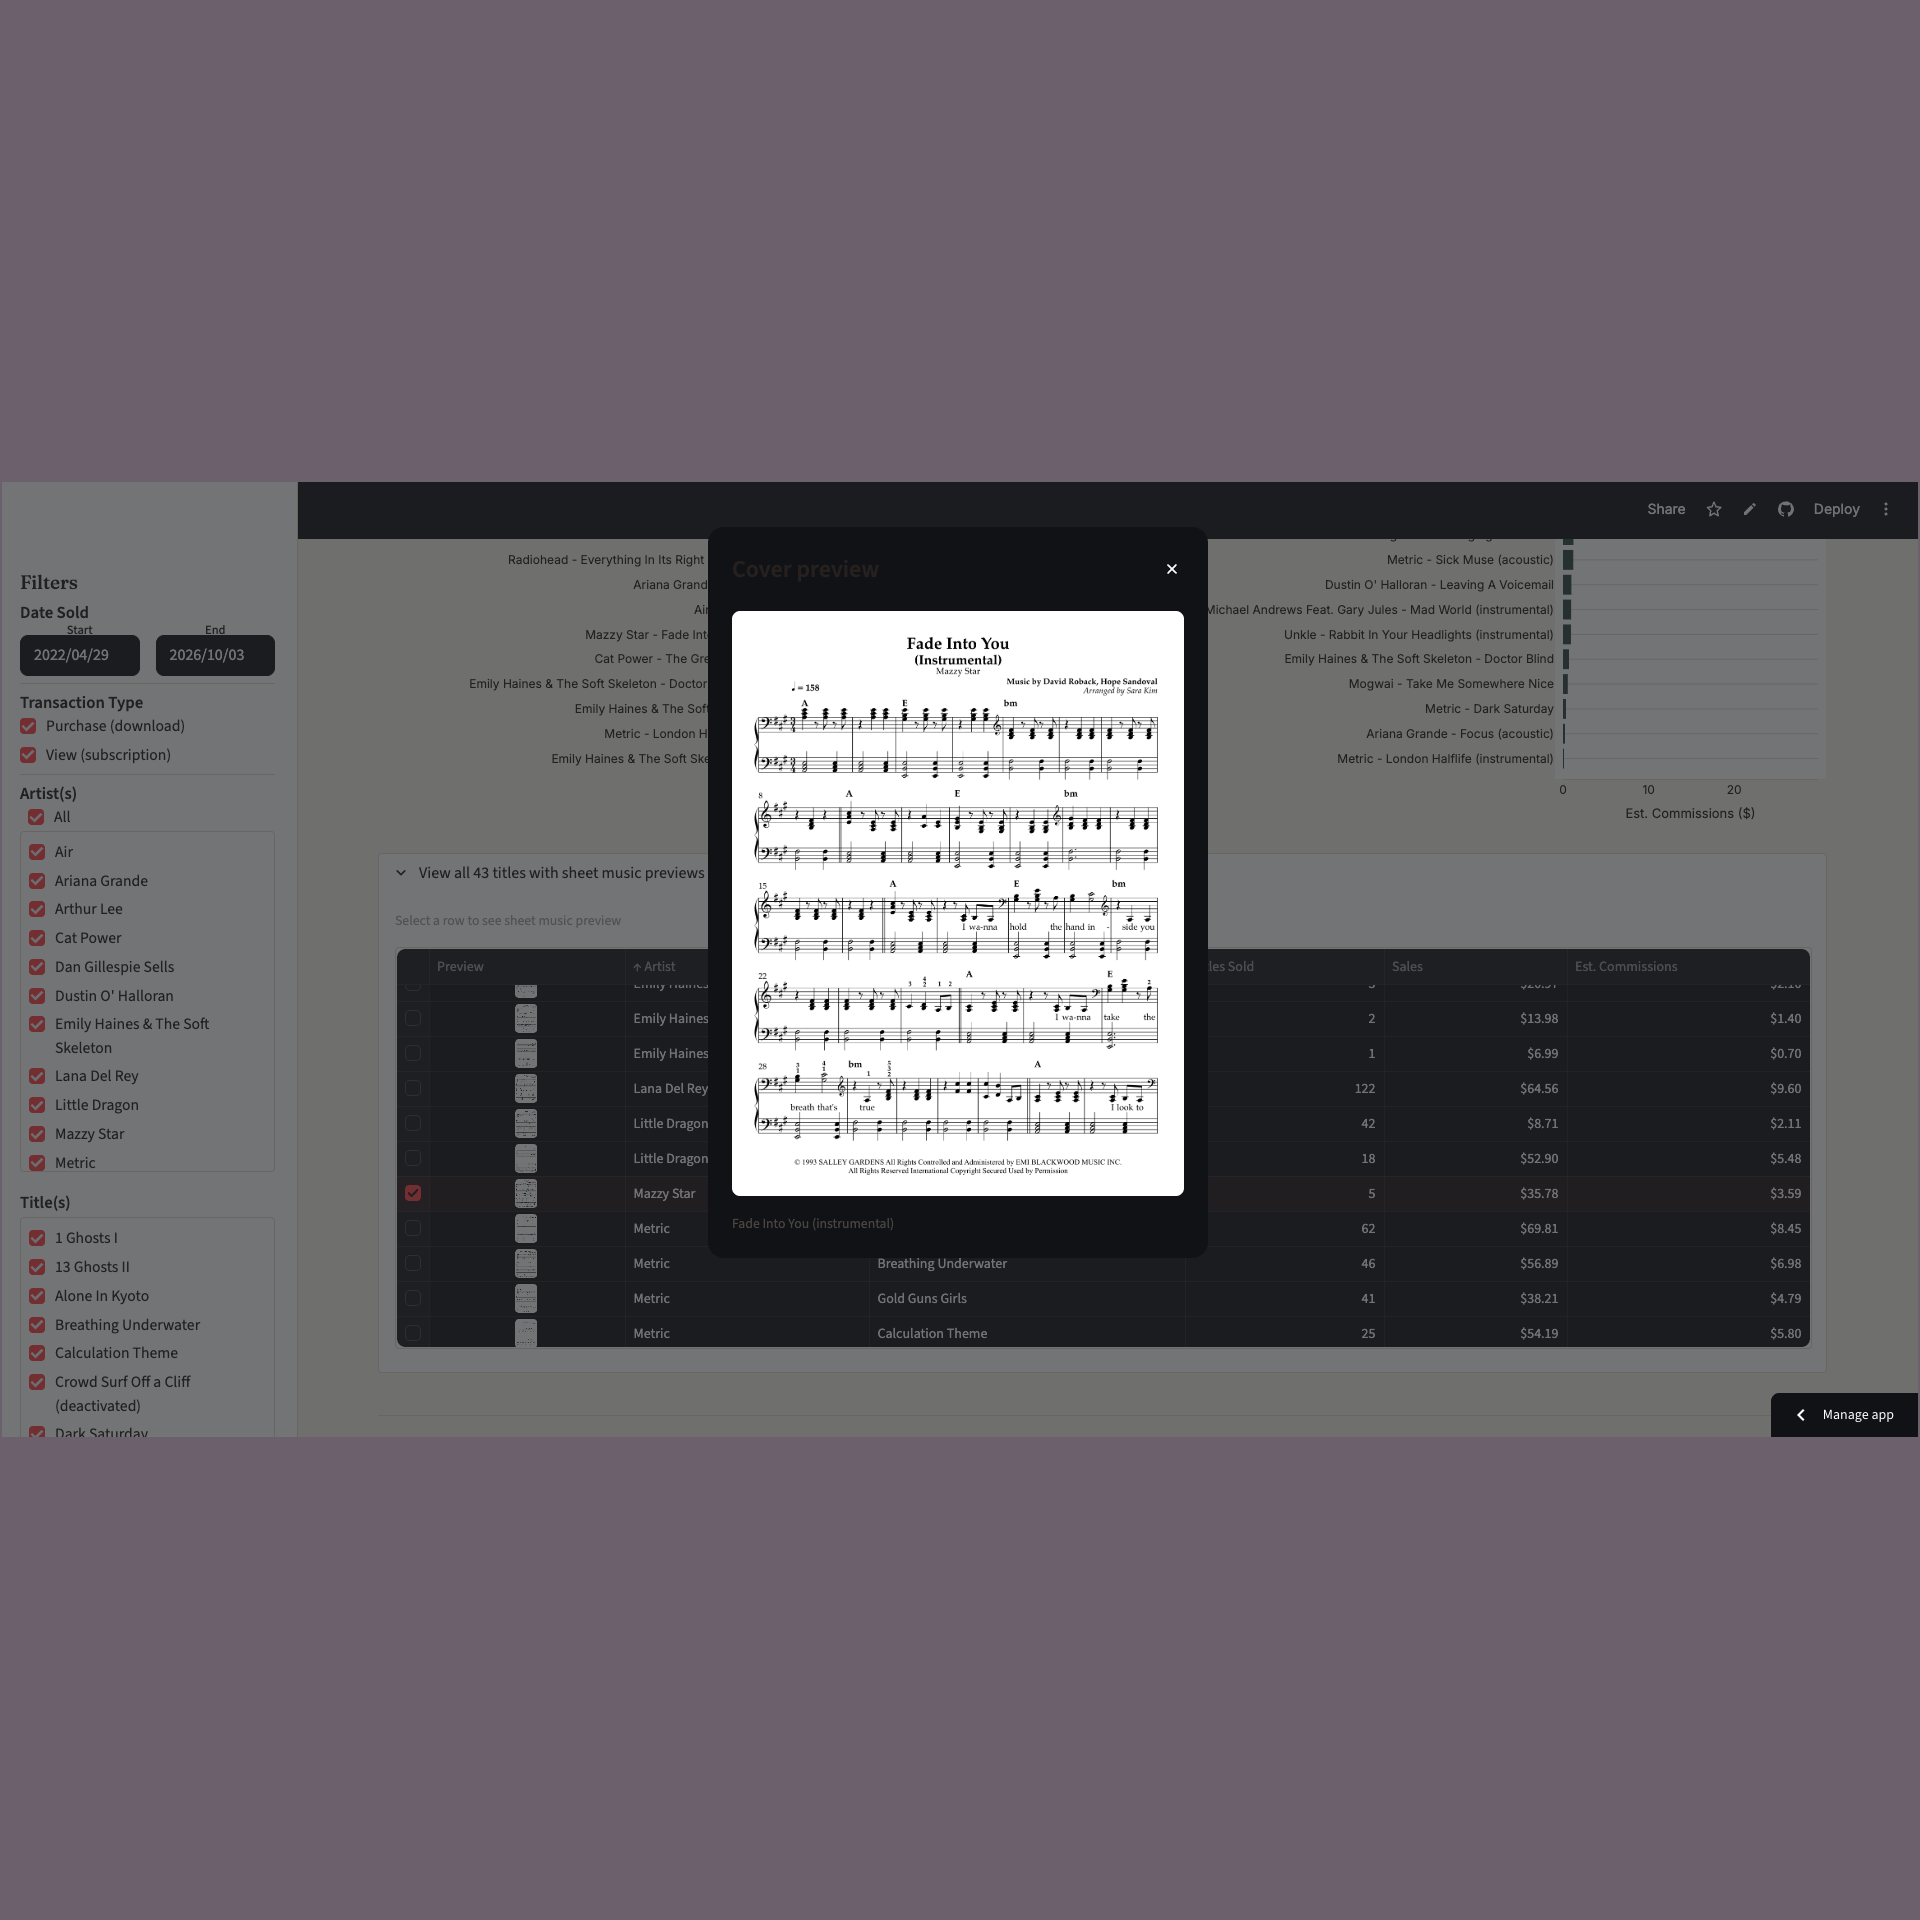
A preview of my instrumental version of Mazzy Star's "Fade Into you", found in the expandable table in the "Titles by Units Sold, Est. Commissions" section
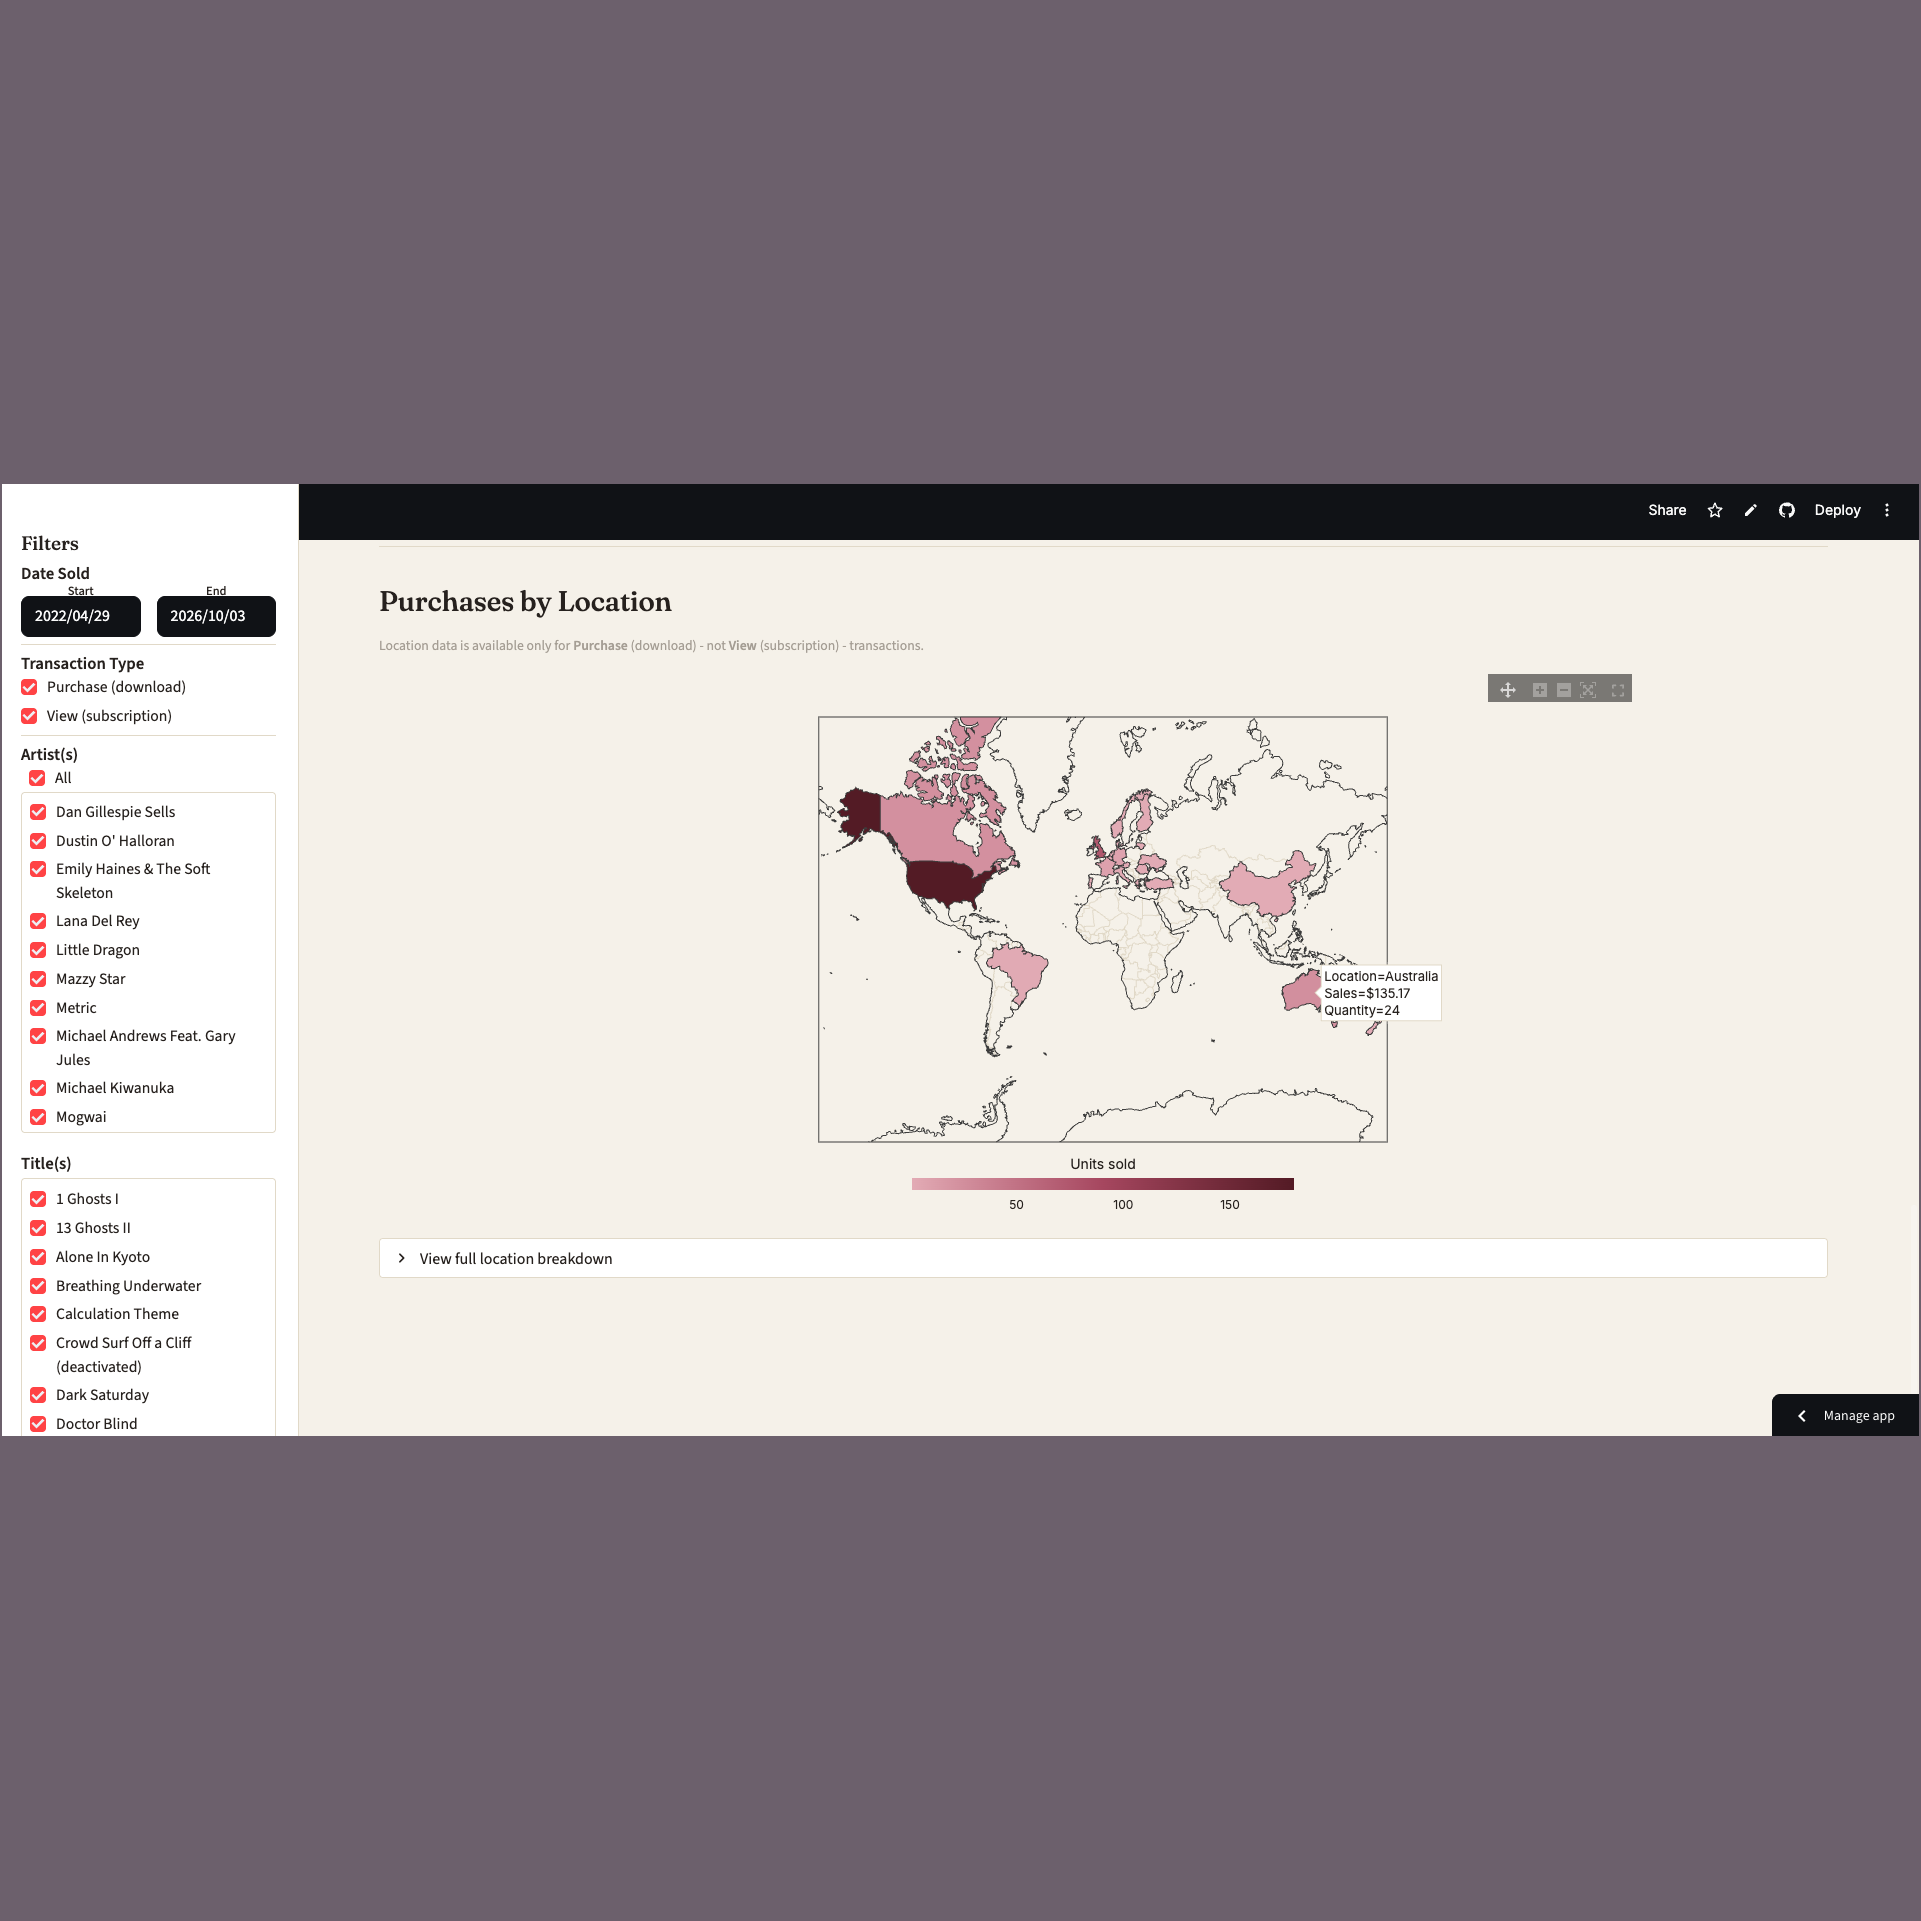
A map showing where Purchases (downloads) were made around the world, with a full breakdown by country underneath in an expandable table
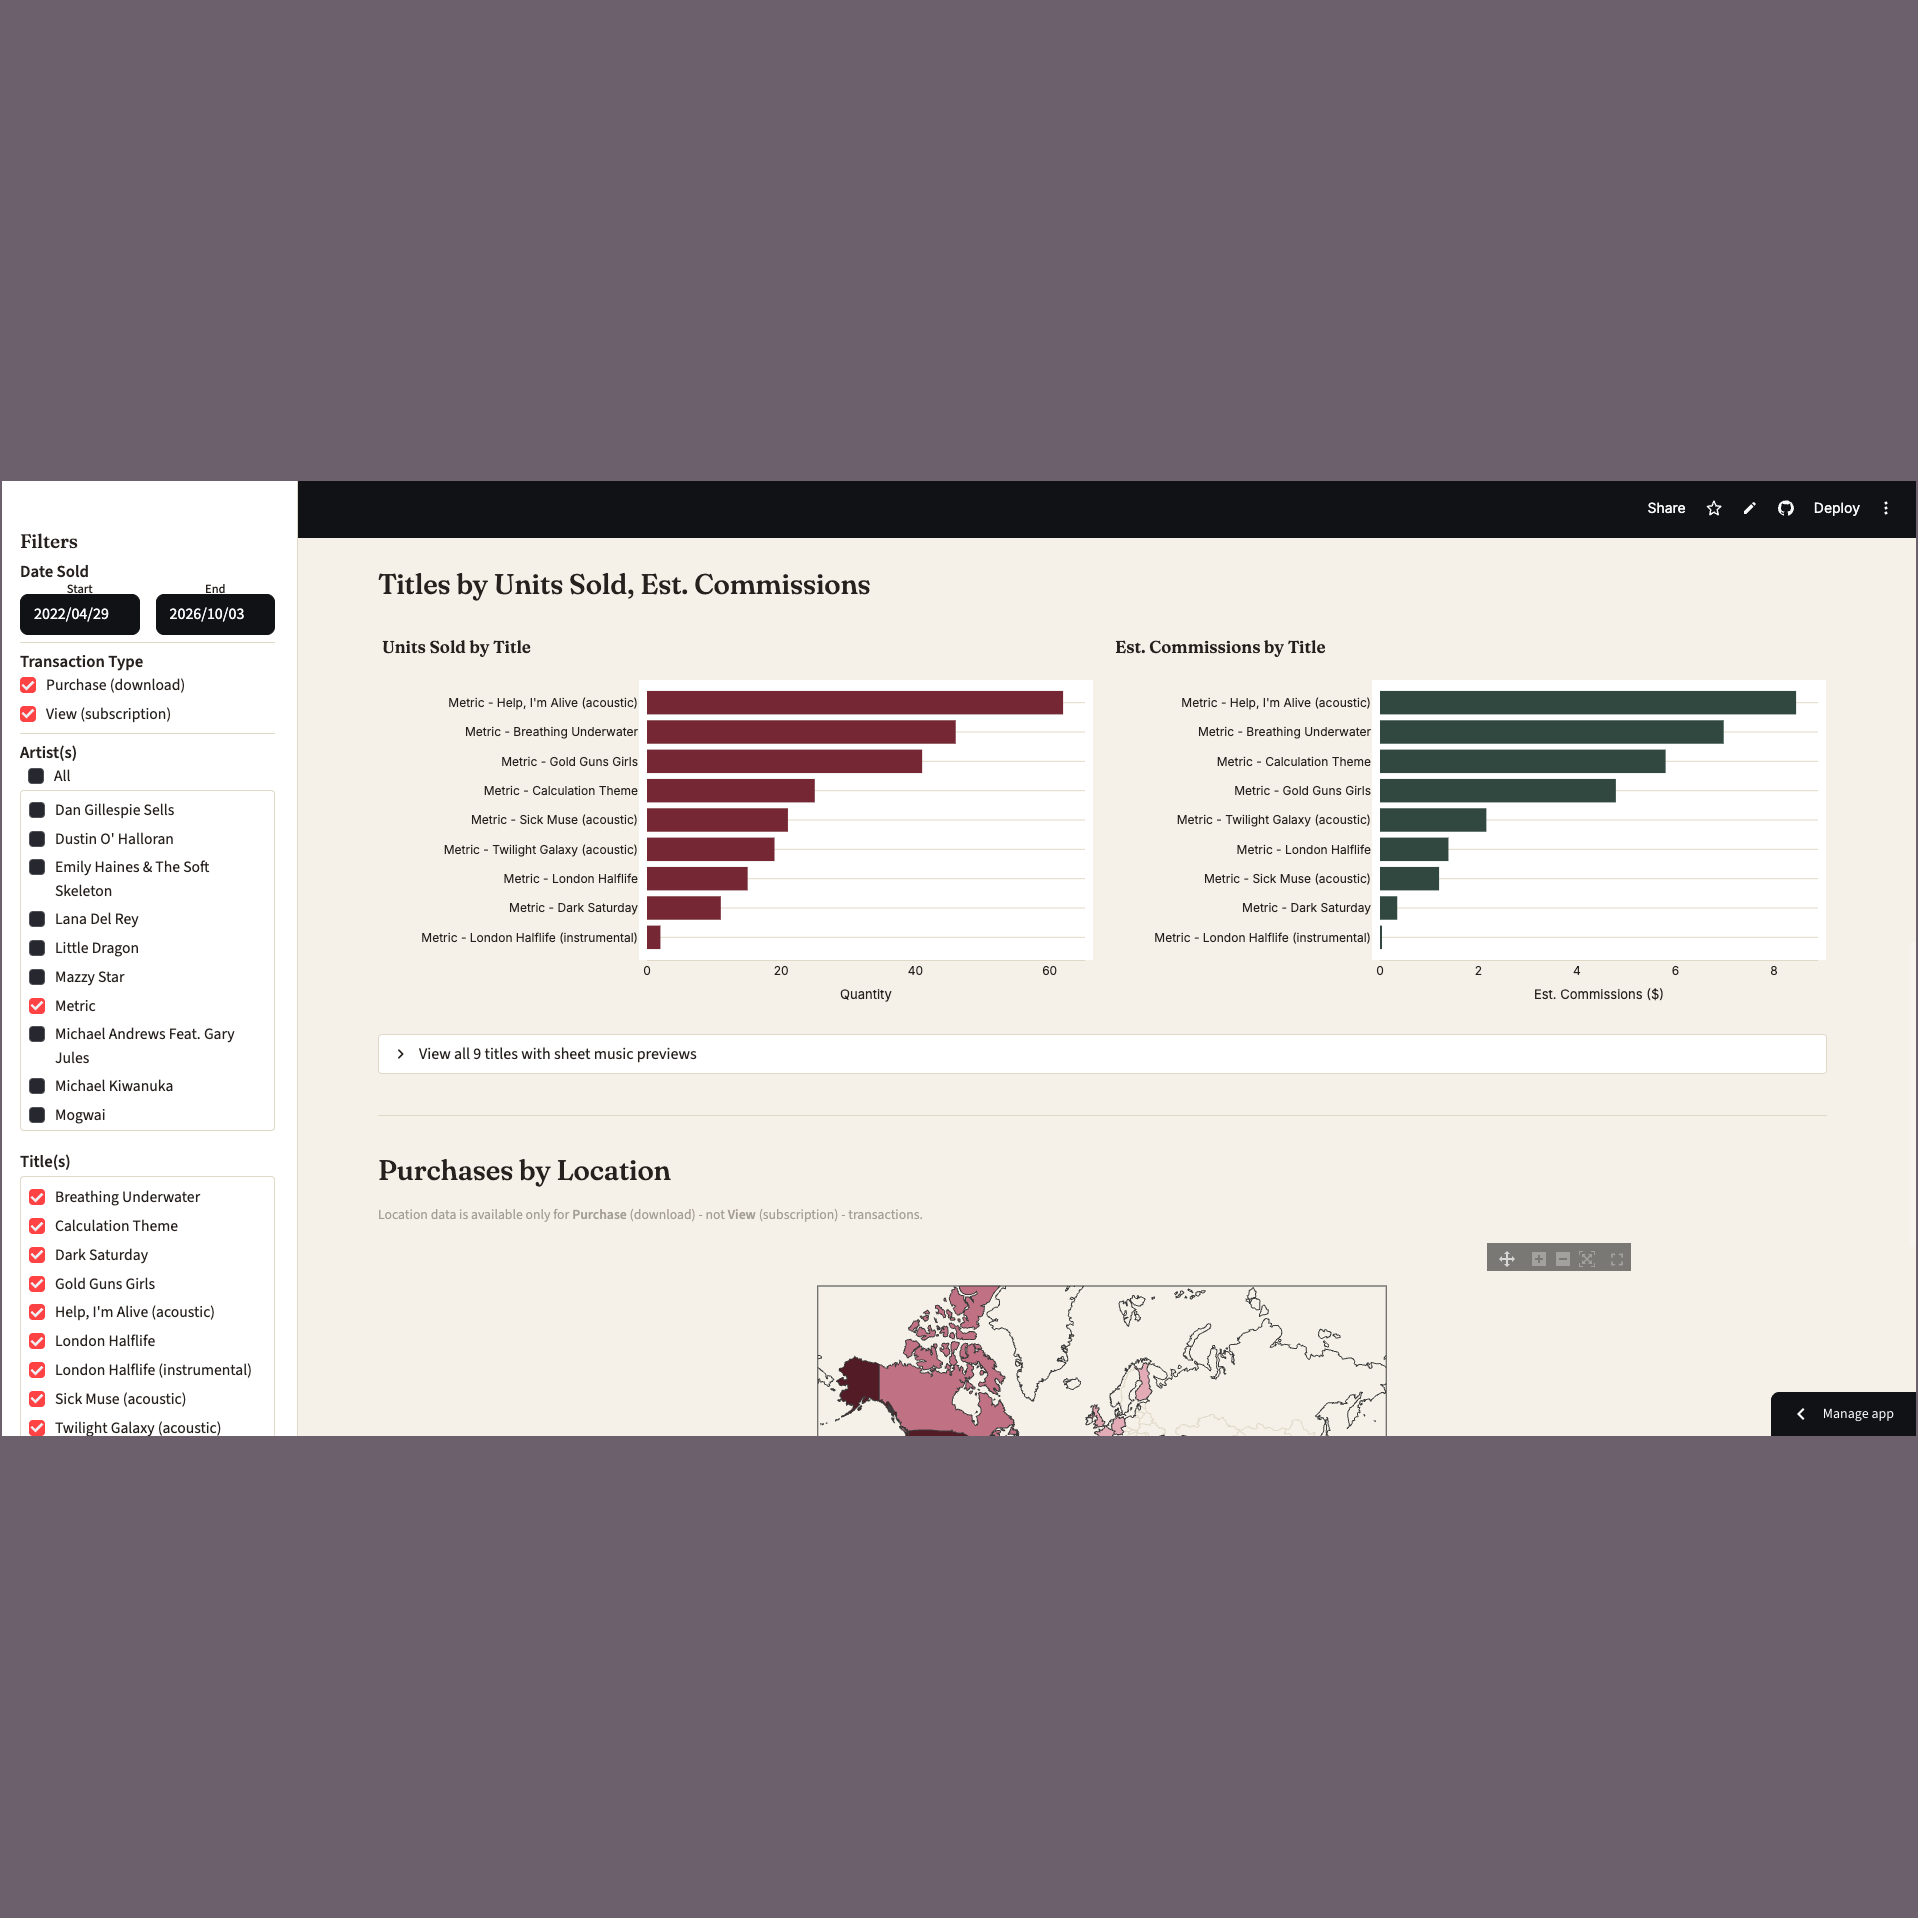
The "Titles by Units Sold, Est. Commissions" and "Purchases by Location" sections reflecting the data for Metric, selected in the Artist(s) filter
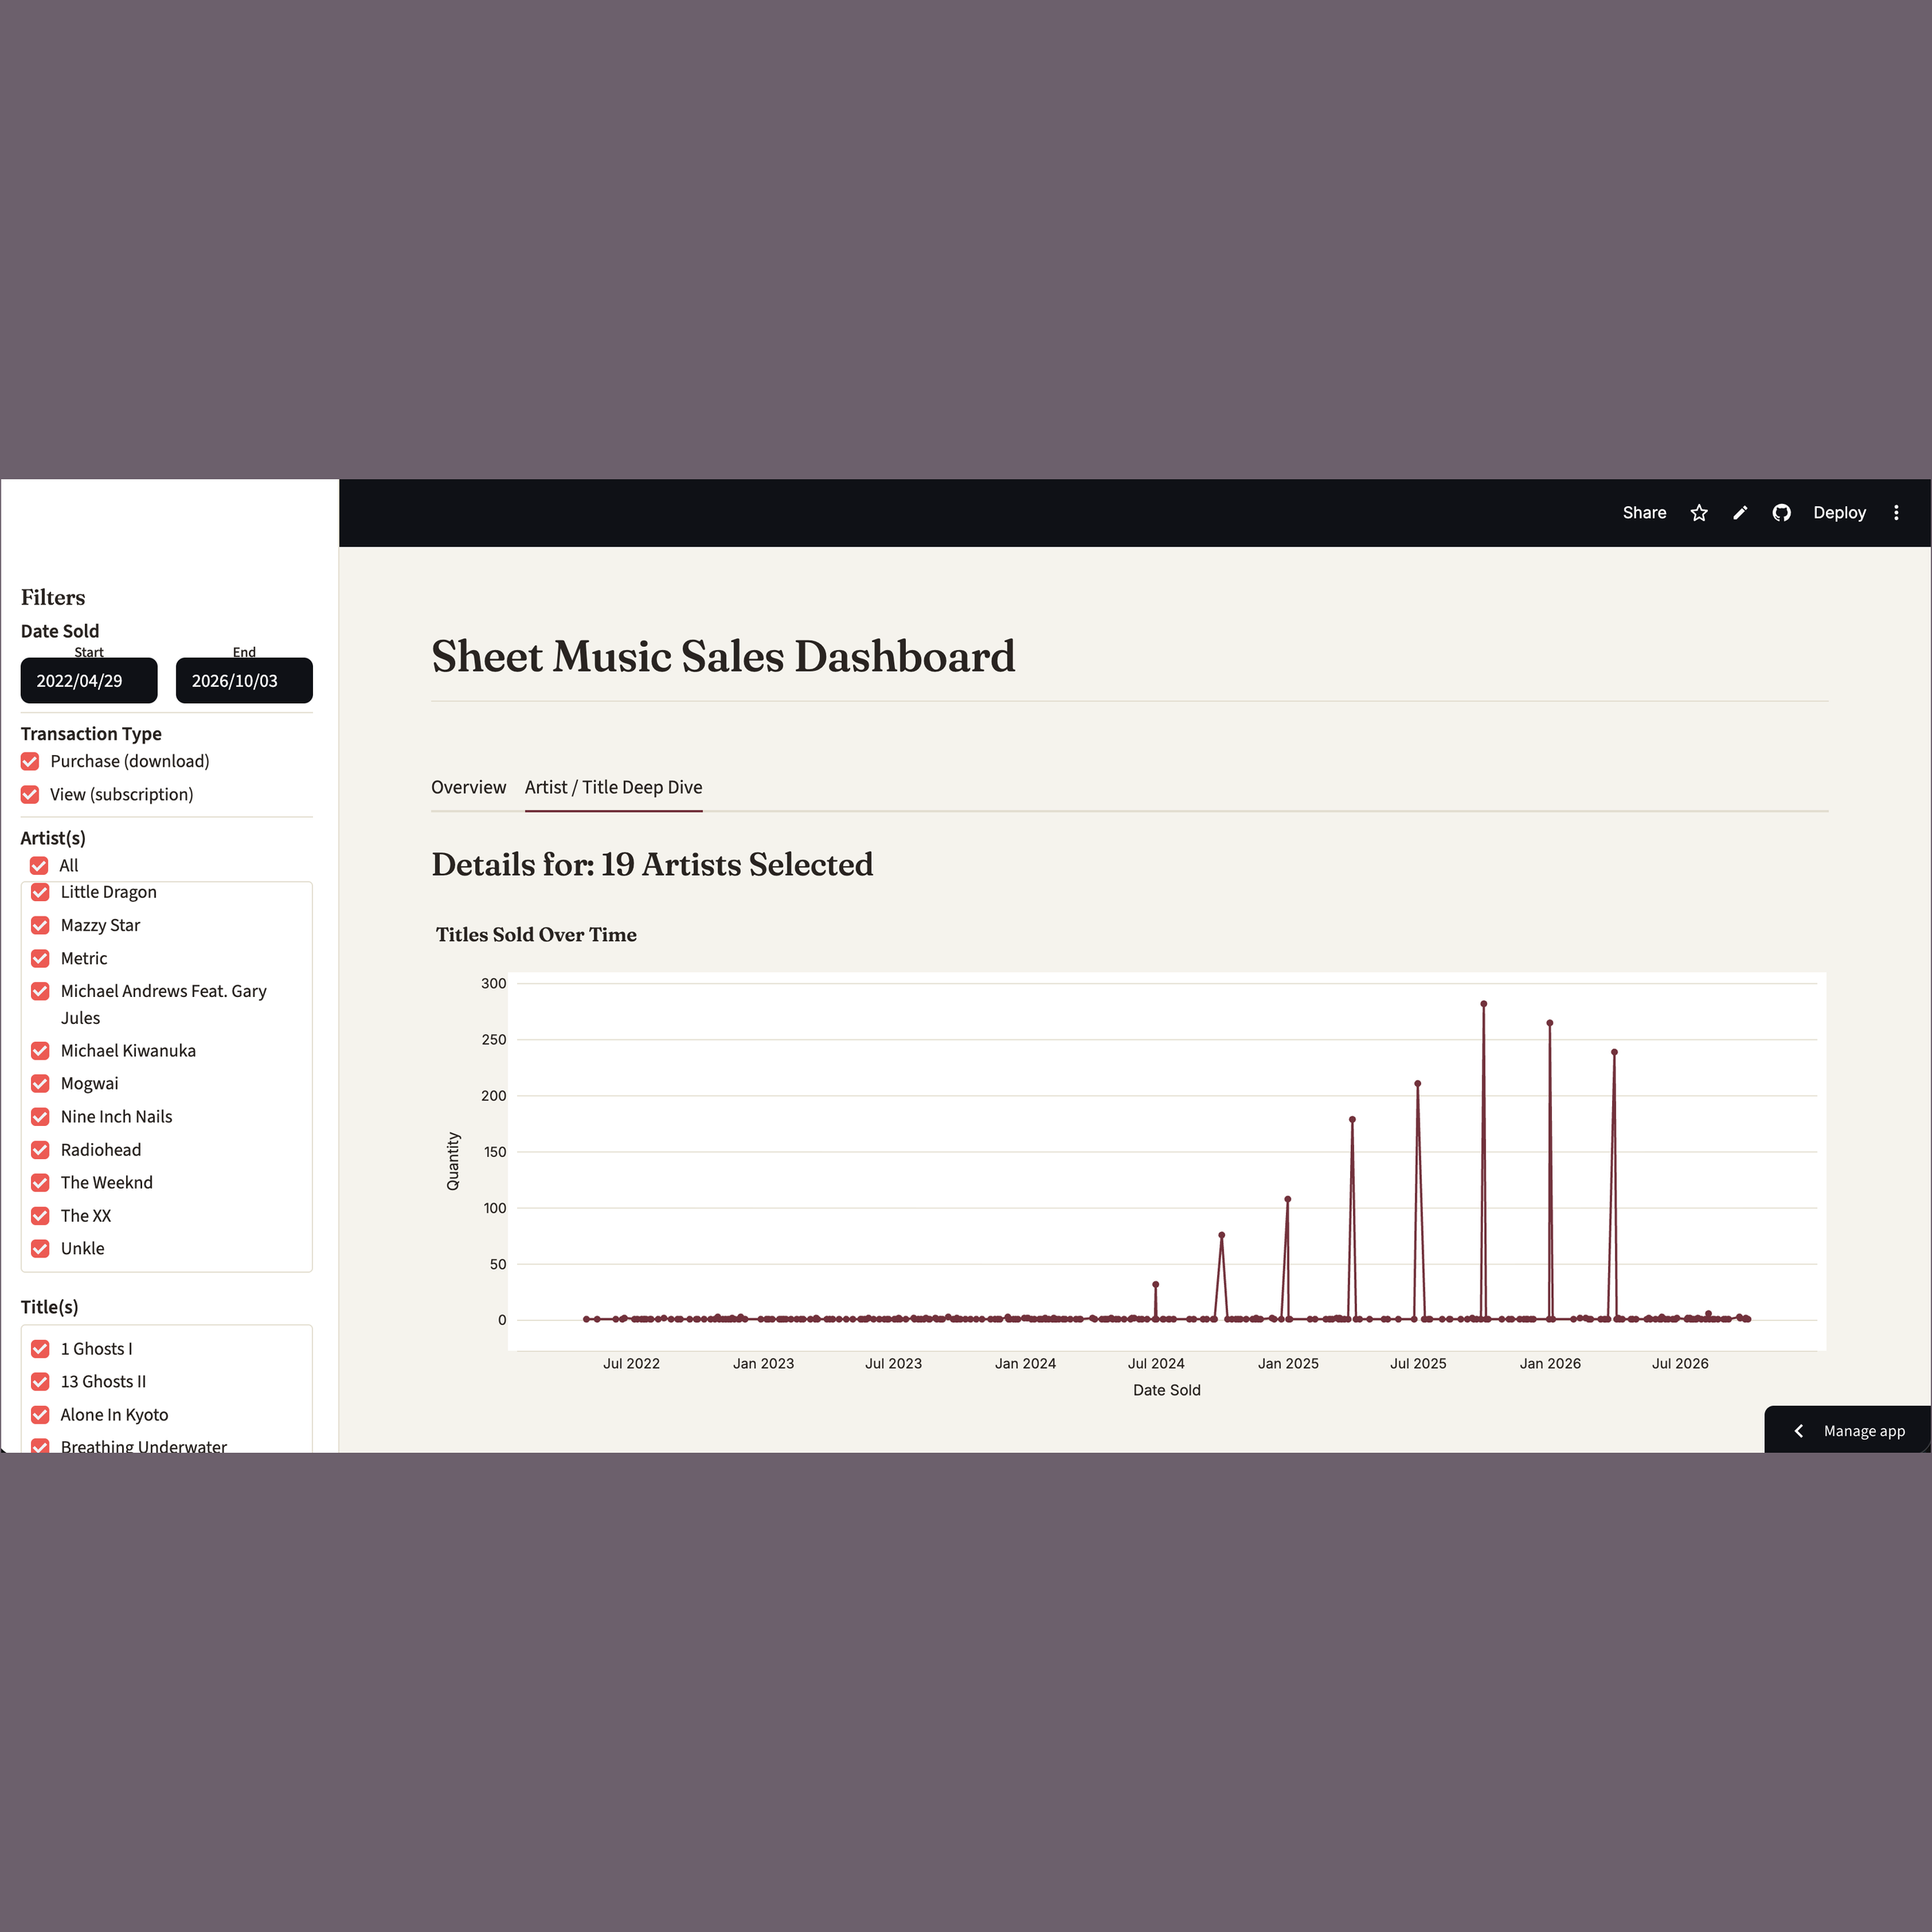
The "Titles Sold Over Time" chart, with spikes at the end of each quarter from June 2024 to March 2026. These come from View (subscription) sales, which were reported quarterly after the site automatically enrolled my titles in its subscription program in April 2024. I opted out once I noticed, and the last quarterly report came in March 2026.
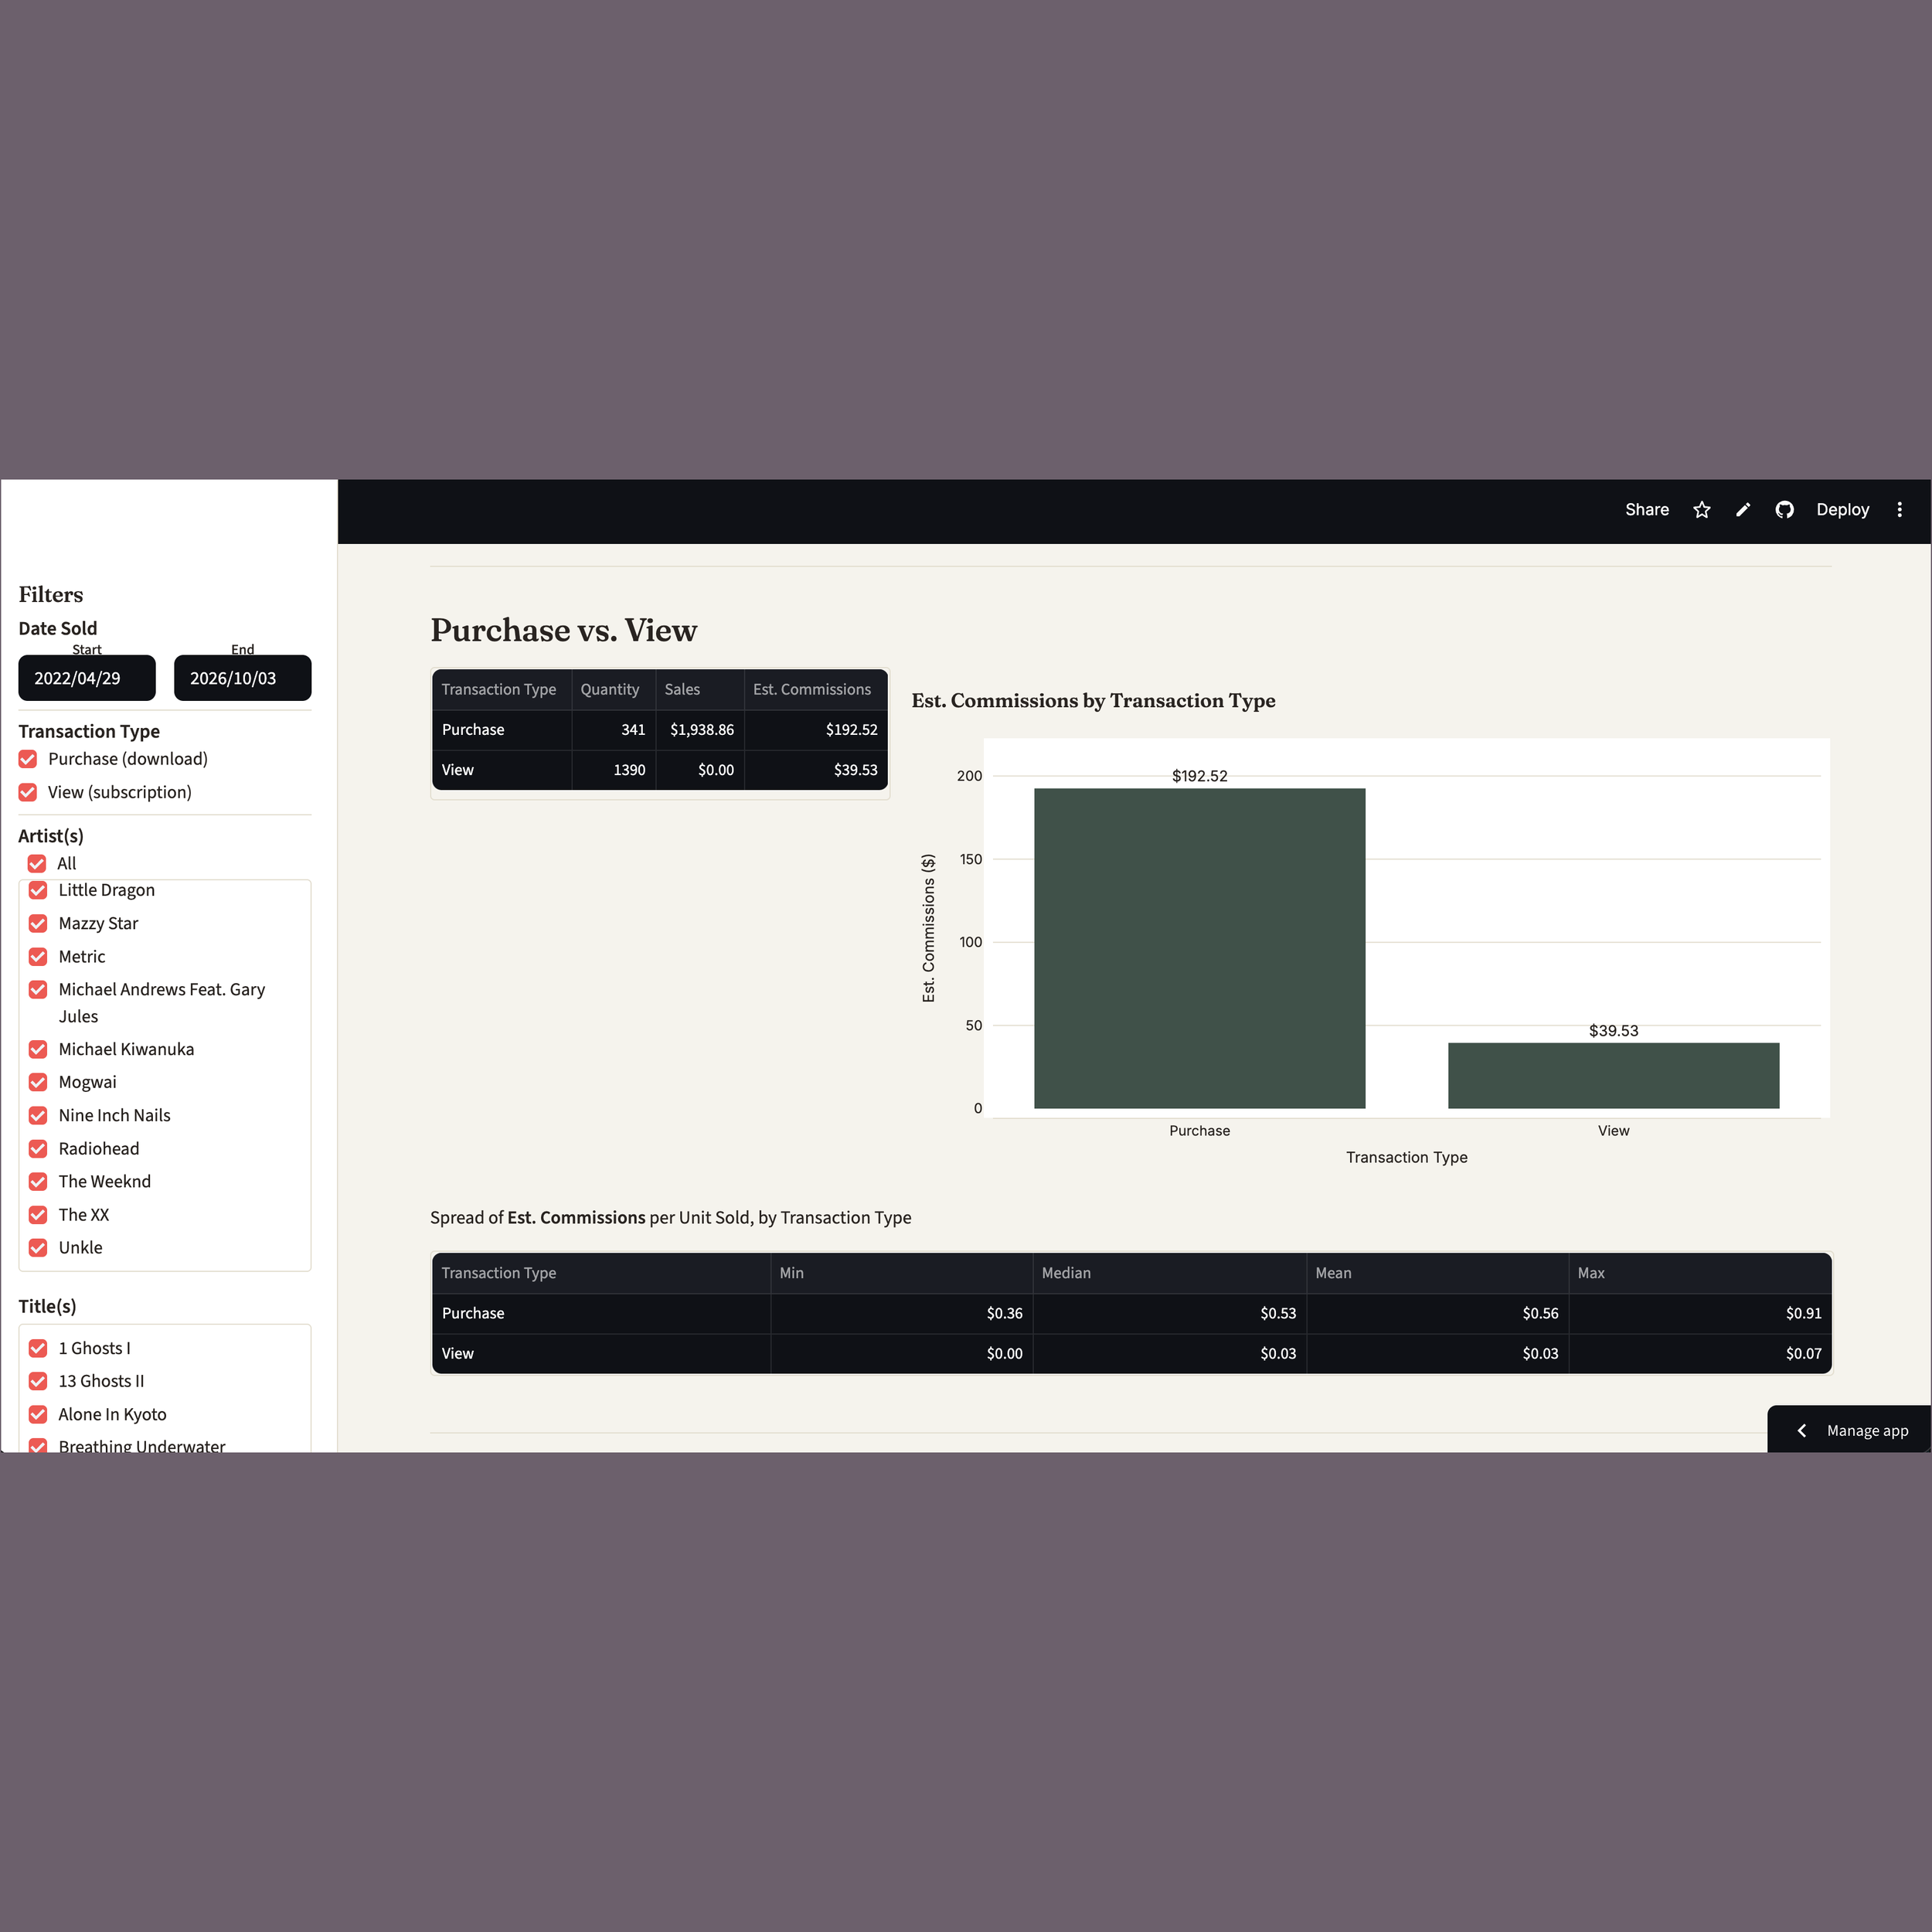
The "Purchase vs. View" section shows how little View (subscription) transactions earn compared with Purchases (downloads)
(For the GitHub repository, please click here, and for the interactive dashboard, please click here.)
Summary
This interactive dashboard tracks sales of my sheet music arrangements, published through ArrangeMe and sold on Sheet Music Plus, Sheet Music Direct, the Sheet Music Direct app, and MuseScore. New sales reports are downloaded and published automatically on a schedule.
It’s built with Streamlit, pandas, Plotly and Playwright.
What's in the dashboard
Sidebar filters (apply to every chart and table)
Date Sold range
Transaction Type: Purchase (download) and/or View (subscription)
Artist(s), with an "All" toggle
Title(s), narrowed to the selected artists
Overview tab
Summary cards: titles sold, total sales, estimated commissions (with averages by transaction type), unique artists, and unique titles (active vs. deactivated)
Units sold and estimated commissions by artist and by title
A full title table with sheet music cover previews (click a row to enlarge)
A world map of purchases by country (location is only recorded for purchases, not views)
Artist / Title Deep Dive tab
Titles sold, sales and commissions over time
Titles sold by channel
Titles by publish date
Purchase vs. View breakdown, including commission per unit sold
How the data works
Download: download_report.py logs into ArrangeMe with a headless browser (Playwright) and saves the latest sales report to data/raw/sales_report_latest.csv.
Publish: update_and_push.py runs the download, then commits and pushes the new report to GitHub. On macOS, sheetmusic.plist schedules it to run automatically with launchd.
Cleaning: dashboard.py corrects titles and adds artist and publish-date information by AME ID.
Cover images: preview images are downloaded from the URLs in THUMBNAIL_URLS and re-checked weekly, so updated covers replace old ones.
The public dashboard never logs in anywhere. It reads the latest report committed to this repo, so no account credentials are stored in the cloud.
Tools Used
Python
pandas
Streamlit
Plotly
Playwright
Requests
Jupyter Notebook
Git
Streamlit Community Cloud