Is There a Relationship Between New Refugee Asylum Applications and “Low-Income” Countries’ GDP-to-IMF Loan Ratios from 2011-2013?
(For the Github page, click here. For the full research report, please click here.)
Executive Summary
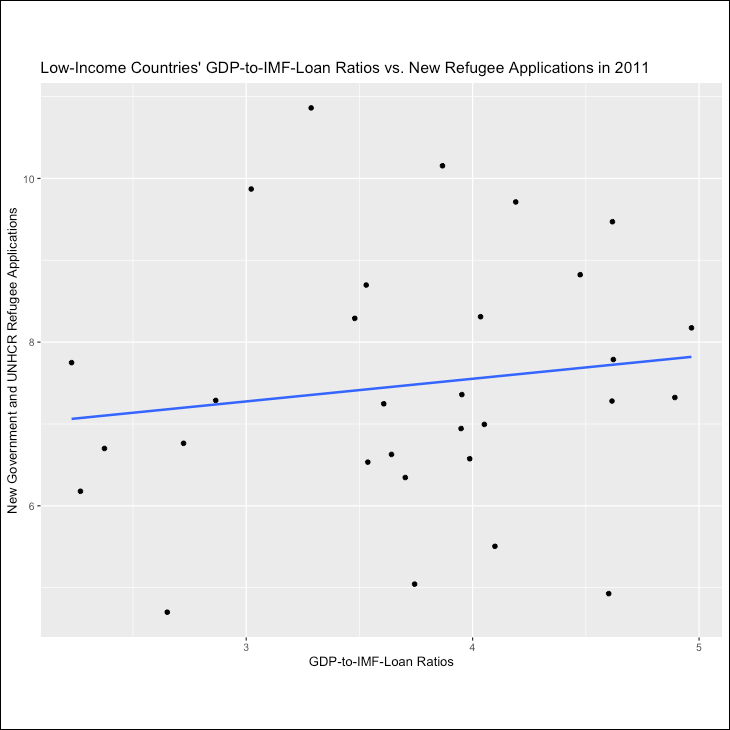
My research question was based on the statement that “I am studying the relationship between the number of combined government and United Nations High Commissioner for Refugees (UNHCR) new refugee applications from International Monetary Fund-categorized 'low-income' countries in the years 2011-2013 to see if there is a correlation between that and their respective GDP-to-IMF-loan-credit ratios during those years.” My research hypothesis was that the GDP-to-IMF-loan-credit ratio is related to the number of new refugee applications for the year, and my null hypothesis was that the number of combined new government and UNHCR refugee applications for the year is not related to the GDP-to-IMF-loan-credit-ratio.
The International Monetary Fund, based in Washington, DC, was established in 1944 at the United Nations Monetary and Financial Conference, aka the Bretton Woods Conference, where 44 nations met to start putting into order the international monetary and financial situation after World War II ended. The original 44 founding member countries were working to create a framework for international economic cooperation. Today's membership includes 190 countries who pay a “capital subscription” when they become a member and then can borrow from this pool of money if and when they face financial difficulties.
I have a personal interest in studying the IMF because—as the child of a father who worked between South Korea and the US my whole life while growing up—I saw the devastation wrought by the IMF East Asian crisis of 1997-1998. The aftereffects went on for years, with my father closing up his small business in Korea and moving back to the US full-time, and even as I started my undergraduate studies in the year 2000, I was forced to my funnel my student loan money to my parents to help them avoid bankruptcy. As a result, I think about those who were/are not so fortunate to be able to search for opportunities elsewhere, and I've pondered such a plight.
Results
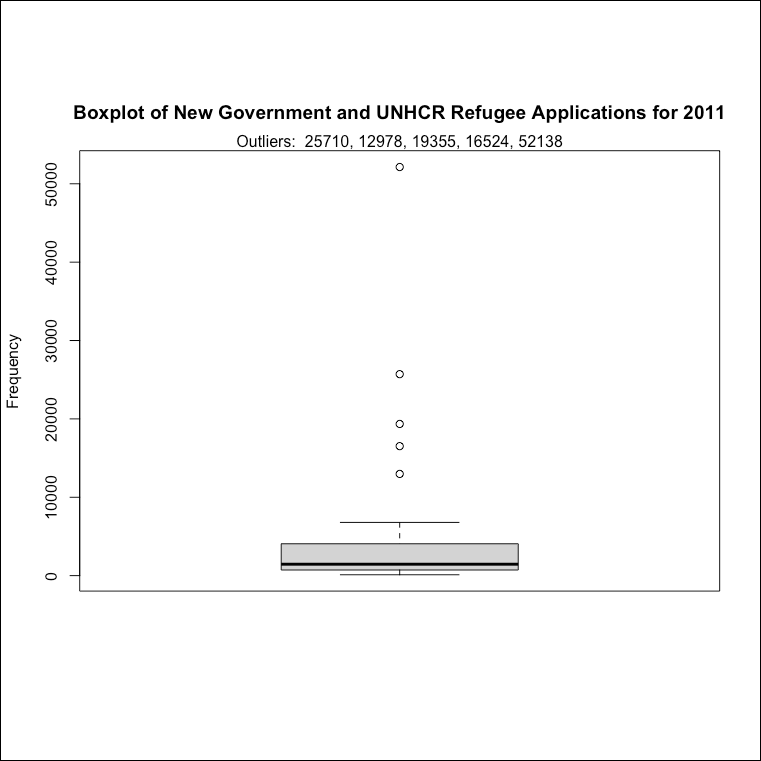
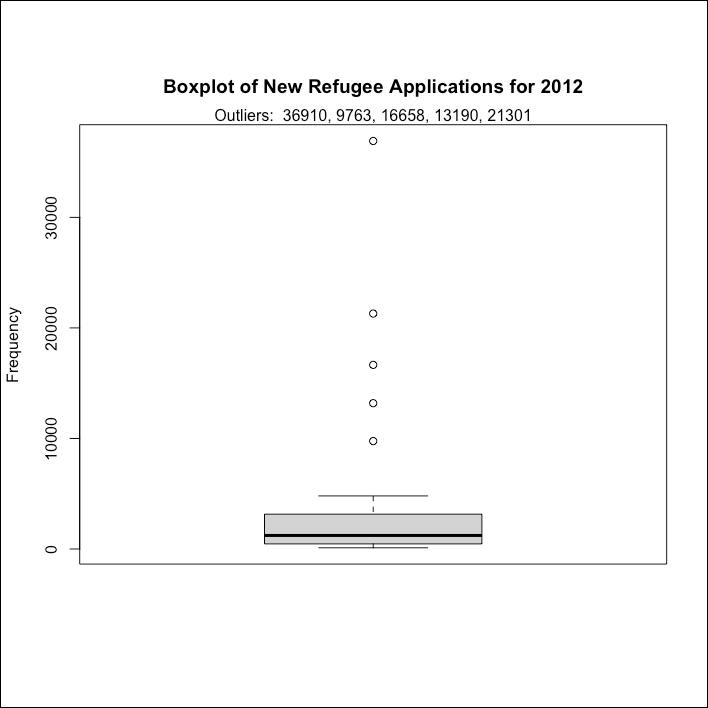
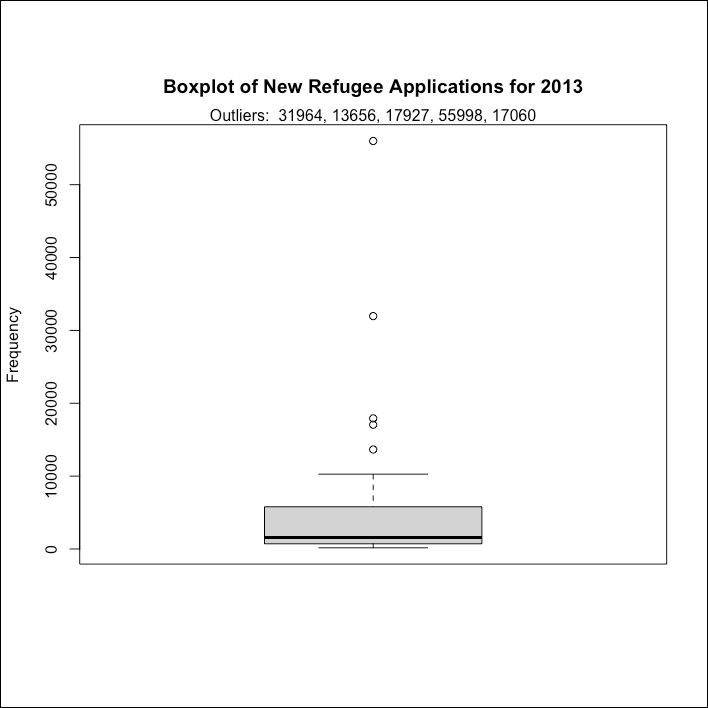
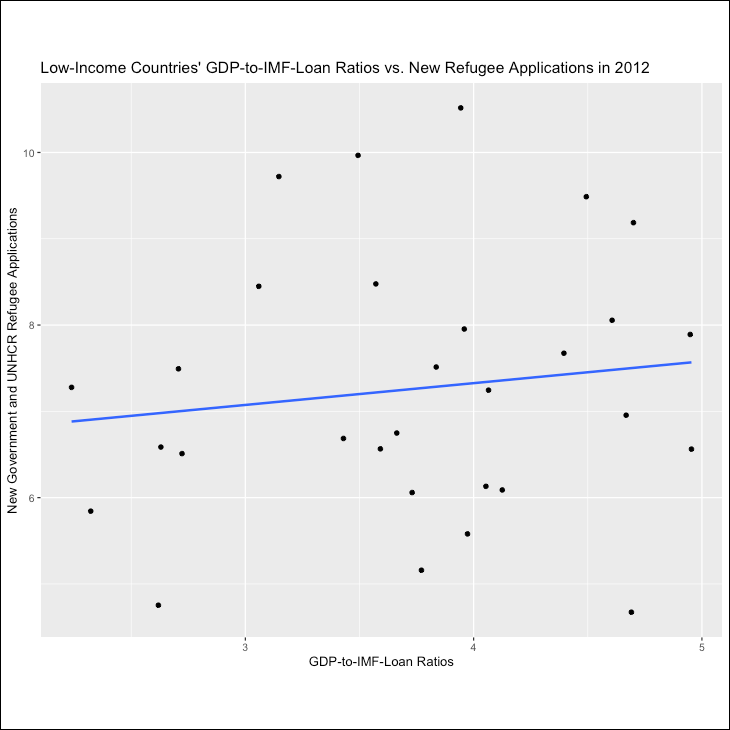
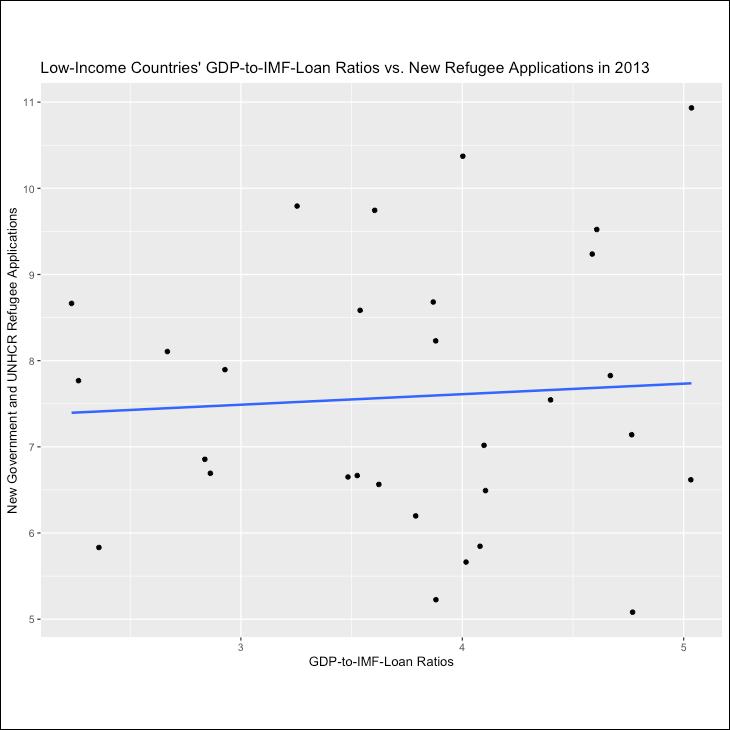
Starting with my original dataset in which all outliers were included, my Pearson's correlation analysis results showed a correlation of -0.082 with a p-value of 0.668 for 2011, a correlation of -0.009 with a p-value of 0.961 for 2012, and a correlation of 0.343 with a p-value of 0.064 for 2013..
My Spearman's Rho correlation analysis results with outliers included showed a correlation of 0.170 with a p-value of 0.367 for 2011, a correlation of 0.092 with a p-value of 0.626 for 2012, and a correlation of -0.033 with p-value of 0.864 for 2013.
My Pearson's correlation analysis results with the outliers included but using the log() function to normalize my data showed a correlation of 0.138 with a p-value of 0.468 for 2011, a correlation of 0.131 with a p-value of 0.491 for 2012, and a correlation of 0.064 with a p-value of 0.738 for 2013.
My Pearson's correlation analysis results with the outliers removed showed a correlation of 0.194 with a p-value of 0.375 for 2011, a correlation of 0.057 with a p-value of 0.788 for 2012, and a correlation of -0.014 with a p-value of 0.431 for 2013.
The Pearson's correlation analysis results with the outliers removed and using the log() function showed a correlation of 0.127 with a p-value of 0.563 for 2011, a correlation of 0.088 with a p-value of 0.675 for 2012, and a correlation of -0.165 with a p-value of 0.431 for 2013.
The Spearman's Rho correlation analysis for this dataset showed a correlation of 0.116 with a p-value of 0.598 for 2011, a correlation of 0.061 with a p-value of 0.773 for 2012, and a correlation of -0.198 with a p-value of 0.34 for 2013.
In conclusion, taking a look across the board at all the different iterations of the correlation analyses, the correlation coefficient results found using the log() function to normalize data ranged from -0.198 at the lowest, which was a Spearman's rho correlation for the 2013 data with outliers removed, to 0.138 at the highest, which was a Pearson's correlation for the 2011 data with outliers removed. All p-values for all results were higher than 0.05. Therefore, I've concluded that the tests were not statistically significant and indicate strong evidence for the null hypothesis, which is that the number of new refugee applications and GDP-to-IMF-loan credit ratios do not have a strong relationship.
Tools Used
Programming language: R
Method
I worked with an existing dataset from the World Bank that shows a list of all IMF credit amounts from 1970 to 2019. (The World Bank also launched in 1944 alongside the IMF at the United Nations Monetary and Financial Conference. It's also based in Washington, DC, and works closely with the IMF towards its goal of reduced poverty throughout the world.) I also utilized a World Bank list of “current classification by income” to figure out which countries were categorized as “low-income,” a World Bank open-access data bank that provided each country's GDP info, a dataset from UNHCR listing the number of refugee asylum applications for the years 2000-2021, and a UNHCR “data content and structure” explanation of the acronyms assigned to the refugee asylum applications.
Based on this last list, I decided to only use the data for the “new” applications (assigned an “N”) and left out all the other applications that were in various other stages of the application process. For example, some were labeled with “R” for repeat applications and “A” for appeal applications, etc.
I also decided to combine applications received by the government (assigned a “G”) and UNHCR (assigned a “U”) as there were significantly different numbers under each column; sometimes the government applications were noticeably higher while at other times the UNHCR application numbers were higher, which insinuated there was no overlap, and so I felt it necessary to combine the two categories into one aggregate number for each country.
Initially, I had planned on using data for all countries categorized as “low-income” for the years 2011-2019. However, I then encountered several instances of some low-income countries being recategorized into “lower-middle” income countries after just a few years after their GNI (gross national income) per capita stats increased, thereby pushing them over the threshold into a new category as well as some countries missing data. As a result, I was left with the years 2011-2013 and 30 countries to work with: Afghanistan, Bangladesh, Benin, Burkina Faso, Burundi, Cambodia, Central African Republic, Chad, Comoros, Dem. Rep. of the Congo, Ethiopia, The Gambia, Guinea, Guinea-Bissau, Haiti, Kenya, Liberia, Madagascar, Malawi, Mali, Mozambique, Myanmar, Nepal, Niger, Rwanda, Sierra Leone, Tanzania, Togo, Uganda, and Zimbabwe.
My plan was to take a quantitative methodological approach and analyze my data by doing a correlation analysis.