Retrieving API Data, Data Cleaning, and Creating a Power BI Dashboard and Python Visualizations
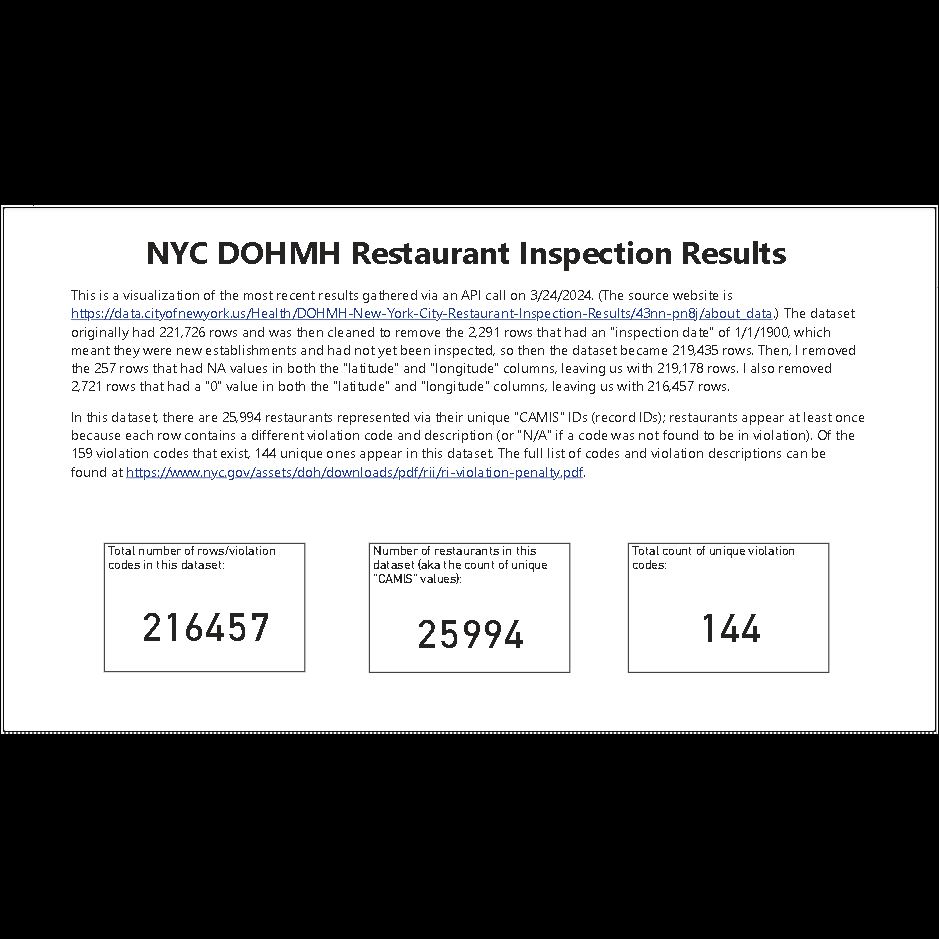
Overview page explaining that the dataset has 216,457 rows; contains 25,994 unique restaurants; and 144 unique violation codes.

A map featuring "Cuisine type," "Violation code," "Borough," "Inspection Date," and "Inspection type" filters.

Bar chart showing the most frequently-occurring violation codes in descending order.

Bar chart showing the restaurants with the most violations in descending order with "Borough," "Cuisine type," and "Inspection date" filters.
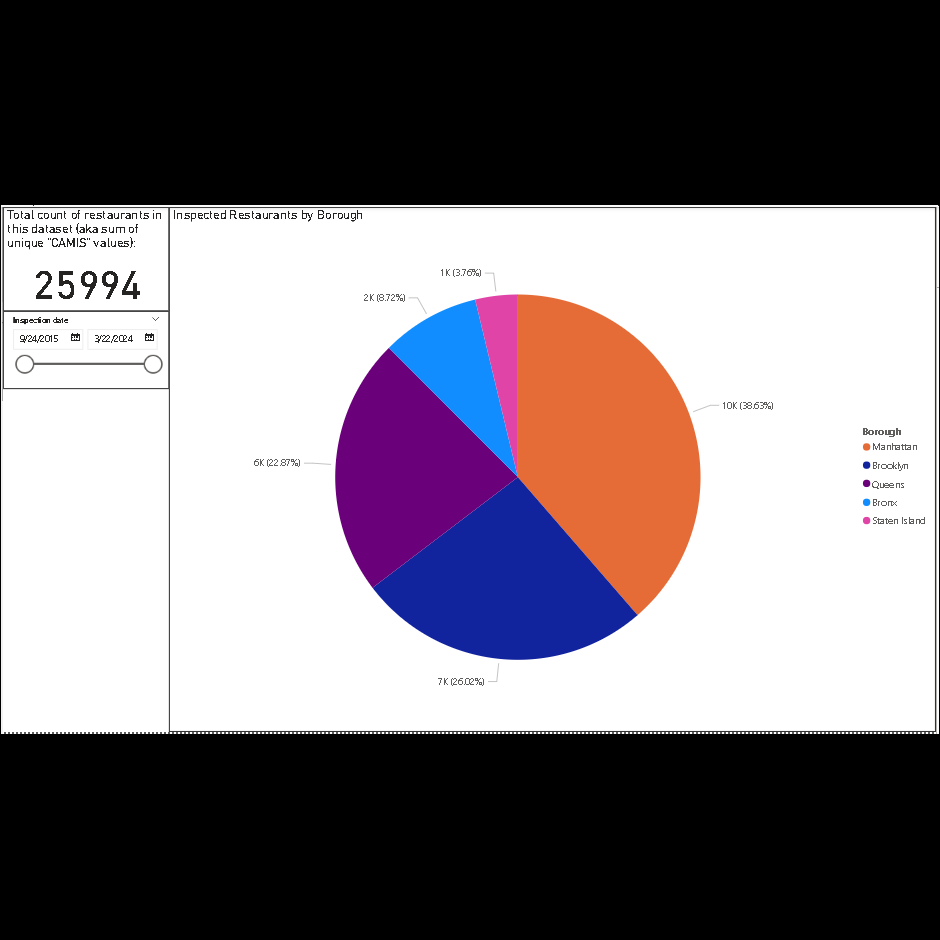
Pie chart of inspected restaurants by borough with an "Inspection date" filter.
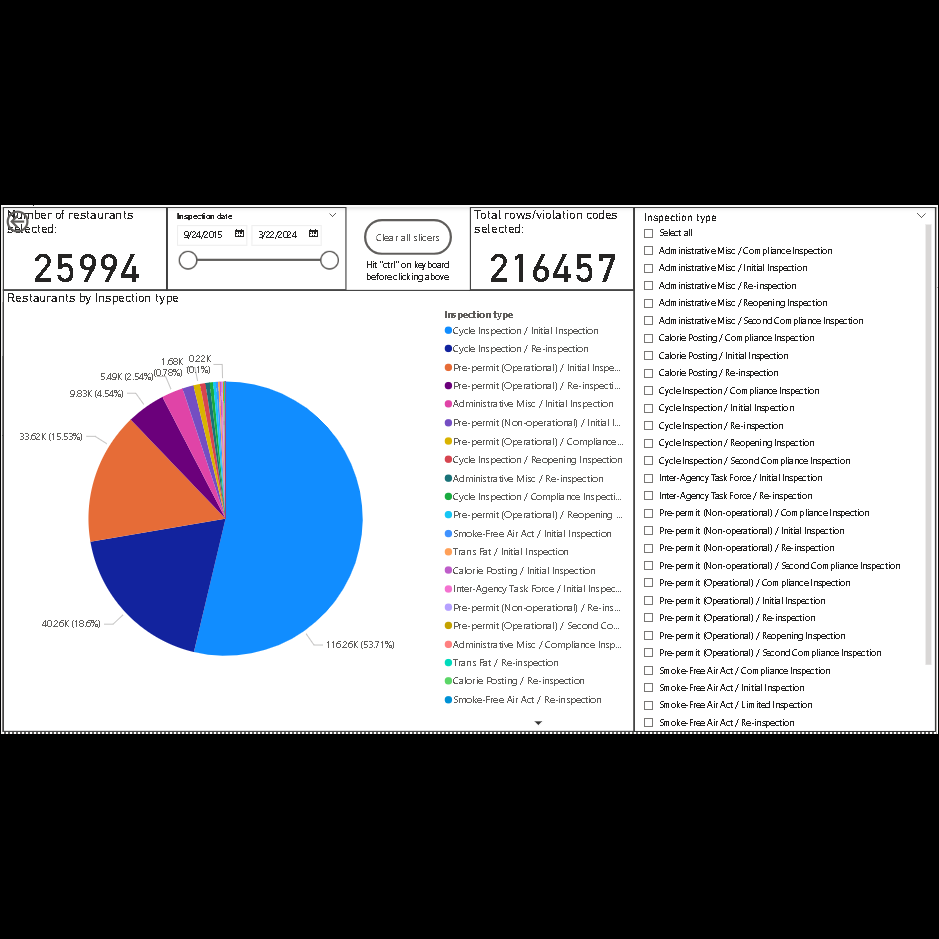
Pie chart showing inspection types.
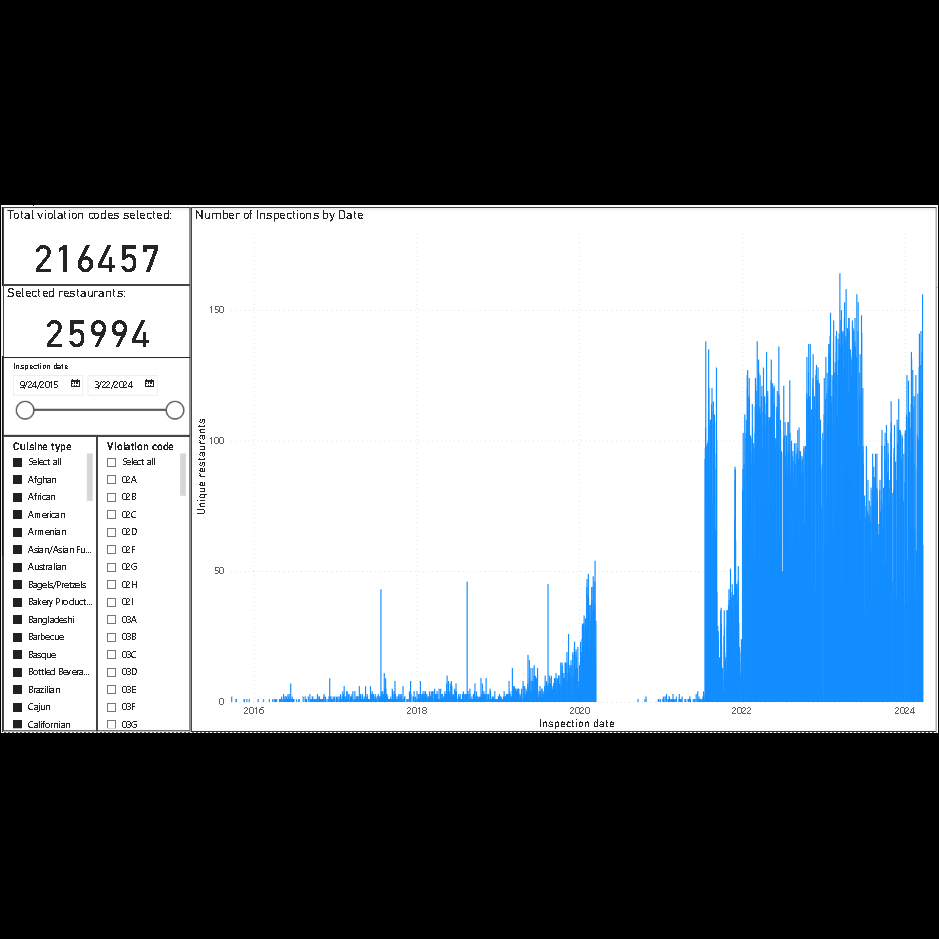
Longitudinal chart showing number of inspections by date.

A map created using folium of the 20 restaurants with the most violation codes.

The top 20 restaurants with the most violation codes, featuring Master Wok with 65; and Mee Sum Cafe, Sun Sai Gai Restaurant, and The Coppola Cafe with 59 each.
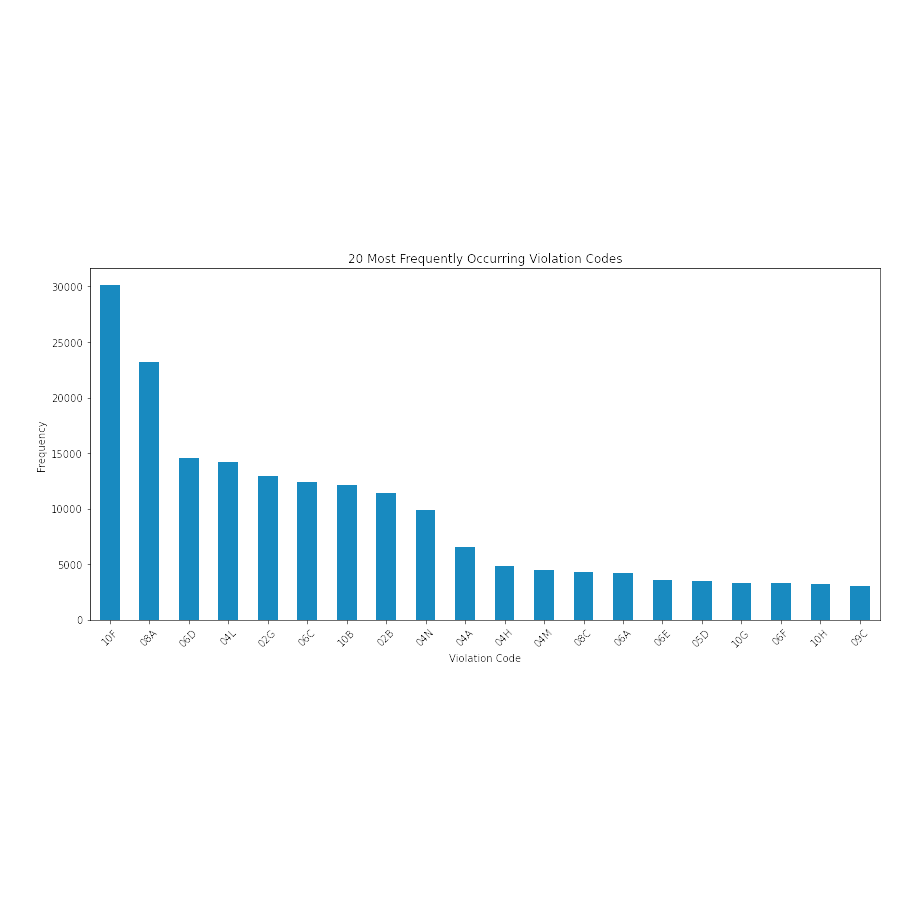
The 20 most-frequently-occurring violation codes with 10F topping the list.
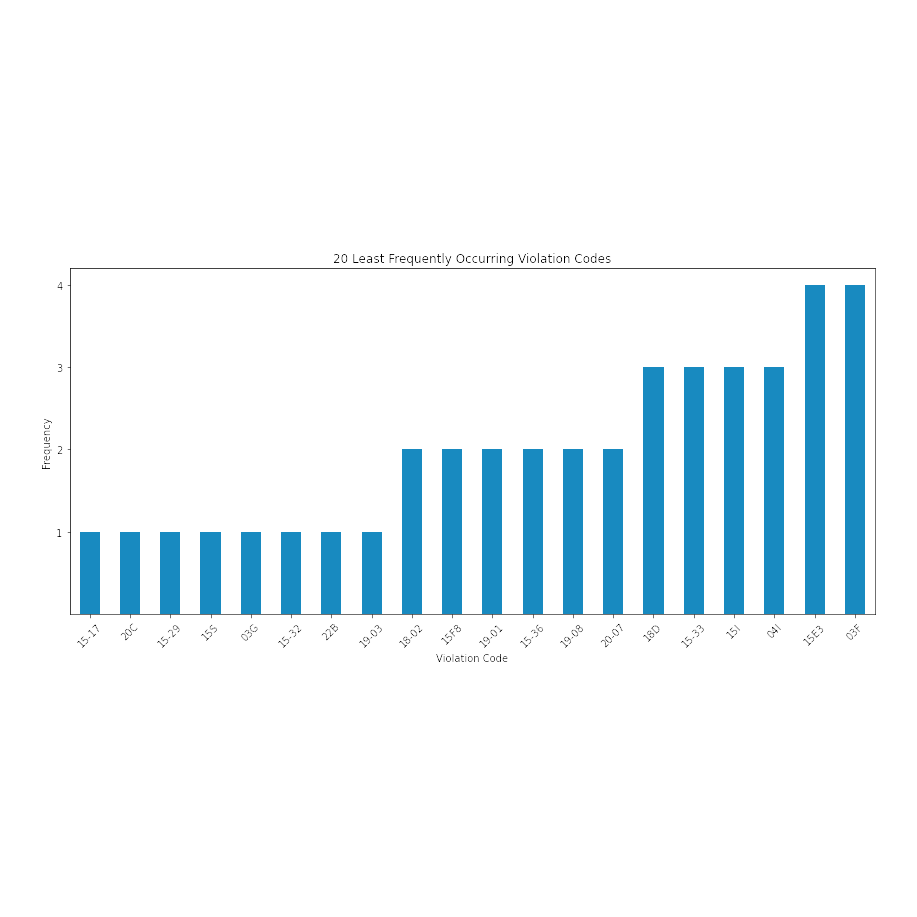
The 20 least-frequently-occurring violation codes with several showing up just once.

Inspections declined considerably during the pandemic.
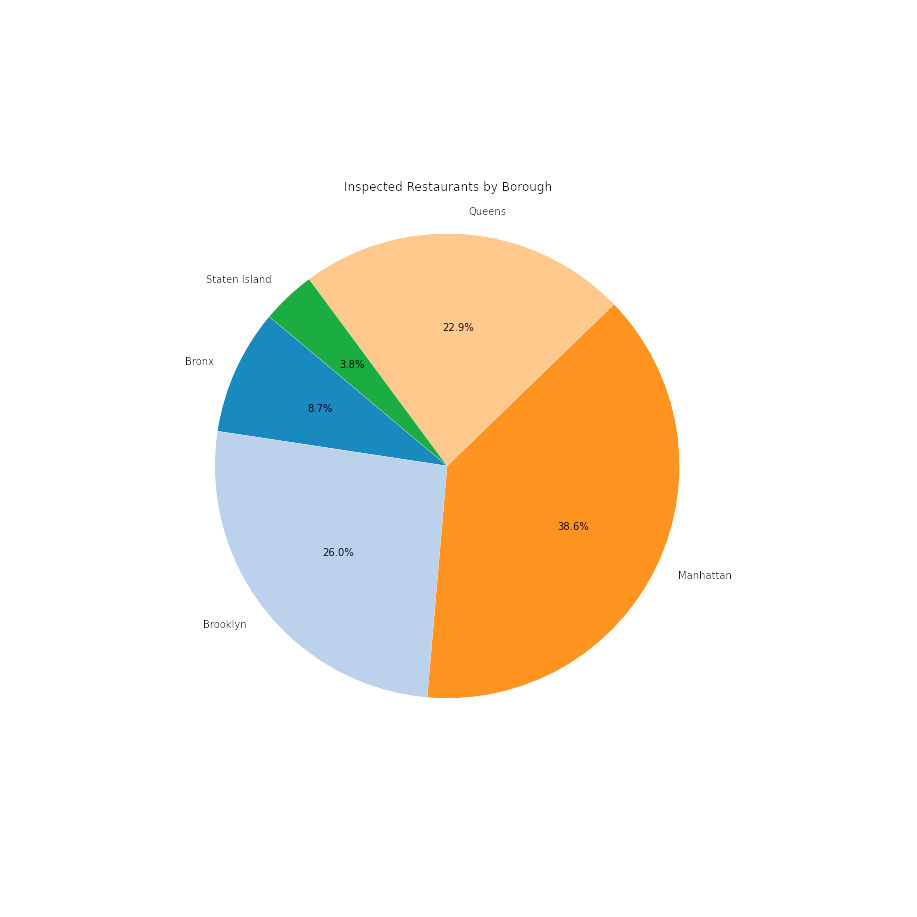
Restaurants that were inspected in Manhattan topped the list at 38.6%.
(For the README file and code, please click here. An interactive version of the Power BI is not currently available. )
Executive Summary
In March 2024, I developed this Power BI dashboard to visualize the NYC Department of Health and Mental Hygiene Restaurant Inspection Results found on the NYC Open Data site.
The API call returned a dataset containing 221,726 rows. After data cleaning, I was left with 216,457 rows. (See the “Method” section to see what I cleaned.) Each row contains a violation code (or “N/A” if no code was found to be violated); a violation description; the restaurant name via a “dba” column and its “CAMIS” ID (record ID), phone number and address; inspection dates; scores; and other info.
In this dataset, the restaurants were inspected between 9/24/2015 and 3/22/2024. There are 25,994 restaurants represented via their unique “CAMIS” IDs; restaurants appear once or many times because each row contains a different violation code and description (or an “N/A” if no code was found to be in violation). So if a restaurant was written up for 13 violation codes, the same CAMIS ID appears 13 times. (It was best to find unique restaurant locations via the CAMIS ID rather than the restaurant name appearing in the “dba” column because if it’s a franchise, then the same restaurant name appears multiple times across multiple unique CAMIS IDs.
Of the 159 violation codes that exist, 144 unique ones appear in this dataset - this includes “N/A” as a value. The full list of codes can be found at https://www.nyc.gov/assets/doh/downloads/pdf/about/healthcode/health-code-chapter23.pdf.
Violation code 10F appeared the most at 30,122 times. In the dataset, this violation states that “Non-food contact surface or equipment made of unacceptable material, not kept clean, or not properly sealed, raised, spaced or movable to allow accessibility for cleaning on all sides, above and underneath the unit,” or “Non-food contact surface improperly constructed. Unacceptable material used. Non-food contact surface or equipment improperly maintained and/or not properly sealed, raised, spaced or movable to allow accessibility for cleaning on all sides, above and underneath the unit.” Violation code 08A occurred next most frequently at 23,165 times, which says “Facility not vermin proof. Harborage or conditions conducive to attracting vermin to the premises and/or allowing vermin to exist,” or “Establishment is not free of harborage or conditions conducive to rodents, insects or other pests.” The third most common violation code was 06D at 14,540 times, which means “Food contact surface not properly washed, rinsed and sanitized after each use and following any activity when contamination may have occurred.”
In terms of cuisine type, of the 25,994 restaurants found in the dataset, the largest percentage, 18.75% (or 4,874) were American restaurants. The next largest percentage, 8.39% (or 2,181) were Chinese restaurants followed by Coffee/Tea restaurants at 7.61% (or 1,977).
The largest proportion of inspected restaurant was located in Manhattan at 38.63% (or 10,041), followed by Brooklyn at 26.02 (or 6,763)%, and then Queens at 22.87% (or 5,946).
The restaurant with the most violations was Master Wok in Brooklyn, who had 65 violation code write-ups. In a second-place tie with 59 violation code write-ups were Mee Sum Cafe, Sun Sai Gai Restaurant, and The Coppola Cafe, all in Manhattan. In third place was 3 Bros 99 Cent Pizza in Queens with 53 violation code write-ups.
Tools Used
Python in Jupyter Notebooks via Visual Studio Code
Power BI
Method
First, I made an API call using Python to the url https://data.cityofnewyork.us/resource/43nn-pn8j.json in a Jupyter Notebook in Visual Studio Code.
The API call returned a dataset containing 221,726 rows. However, 2,291 of the rows had an “inspection date” of 1/1/1900 - which meant that they were new establishments and had not yet been inspected - so I removed those and was left with 219,435 rows. Then, I removed the 257 rows that had NA values in both the “latitude” and “longitude” columns, leaving me with 219,178 rows. I also removed 2,721 rows that had a “0” value” in both the “latitude” and “longitude” columns, leaving me with 216,457 rows.
I wrote the dataset to a csv file, then imported it into Power BI where I created the visualizations and filters.
I also read the csv file into Visual Studio Code and created the visualizations above in Python.