Dashboard Featuring HDFC Listings in March 2023 Built with R Shiny/ShinyDashboard

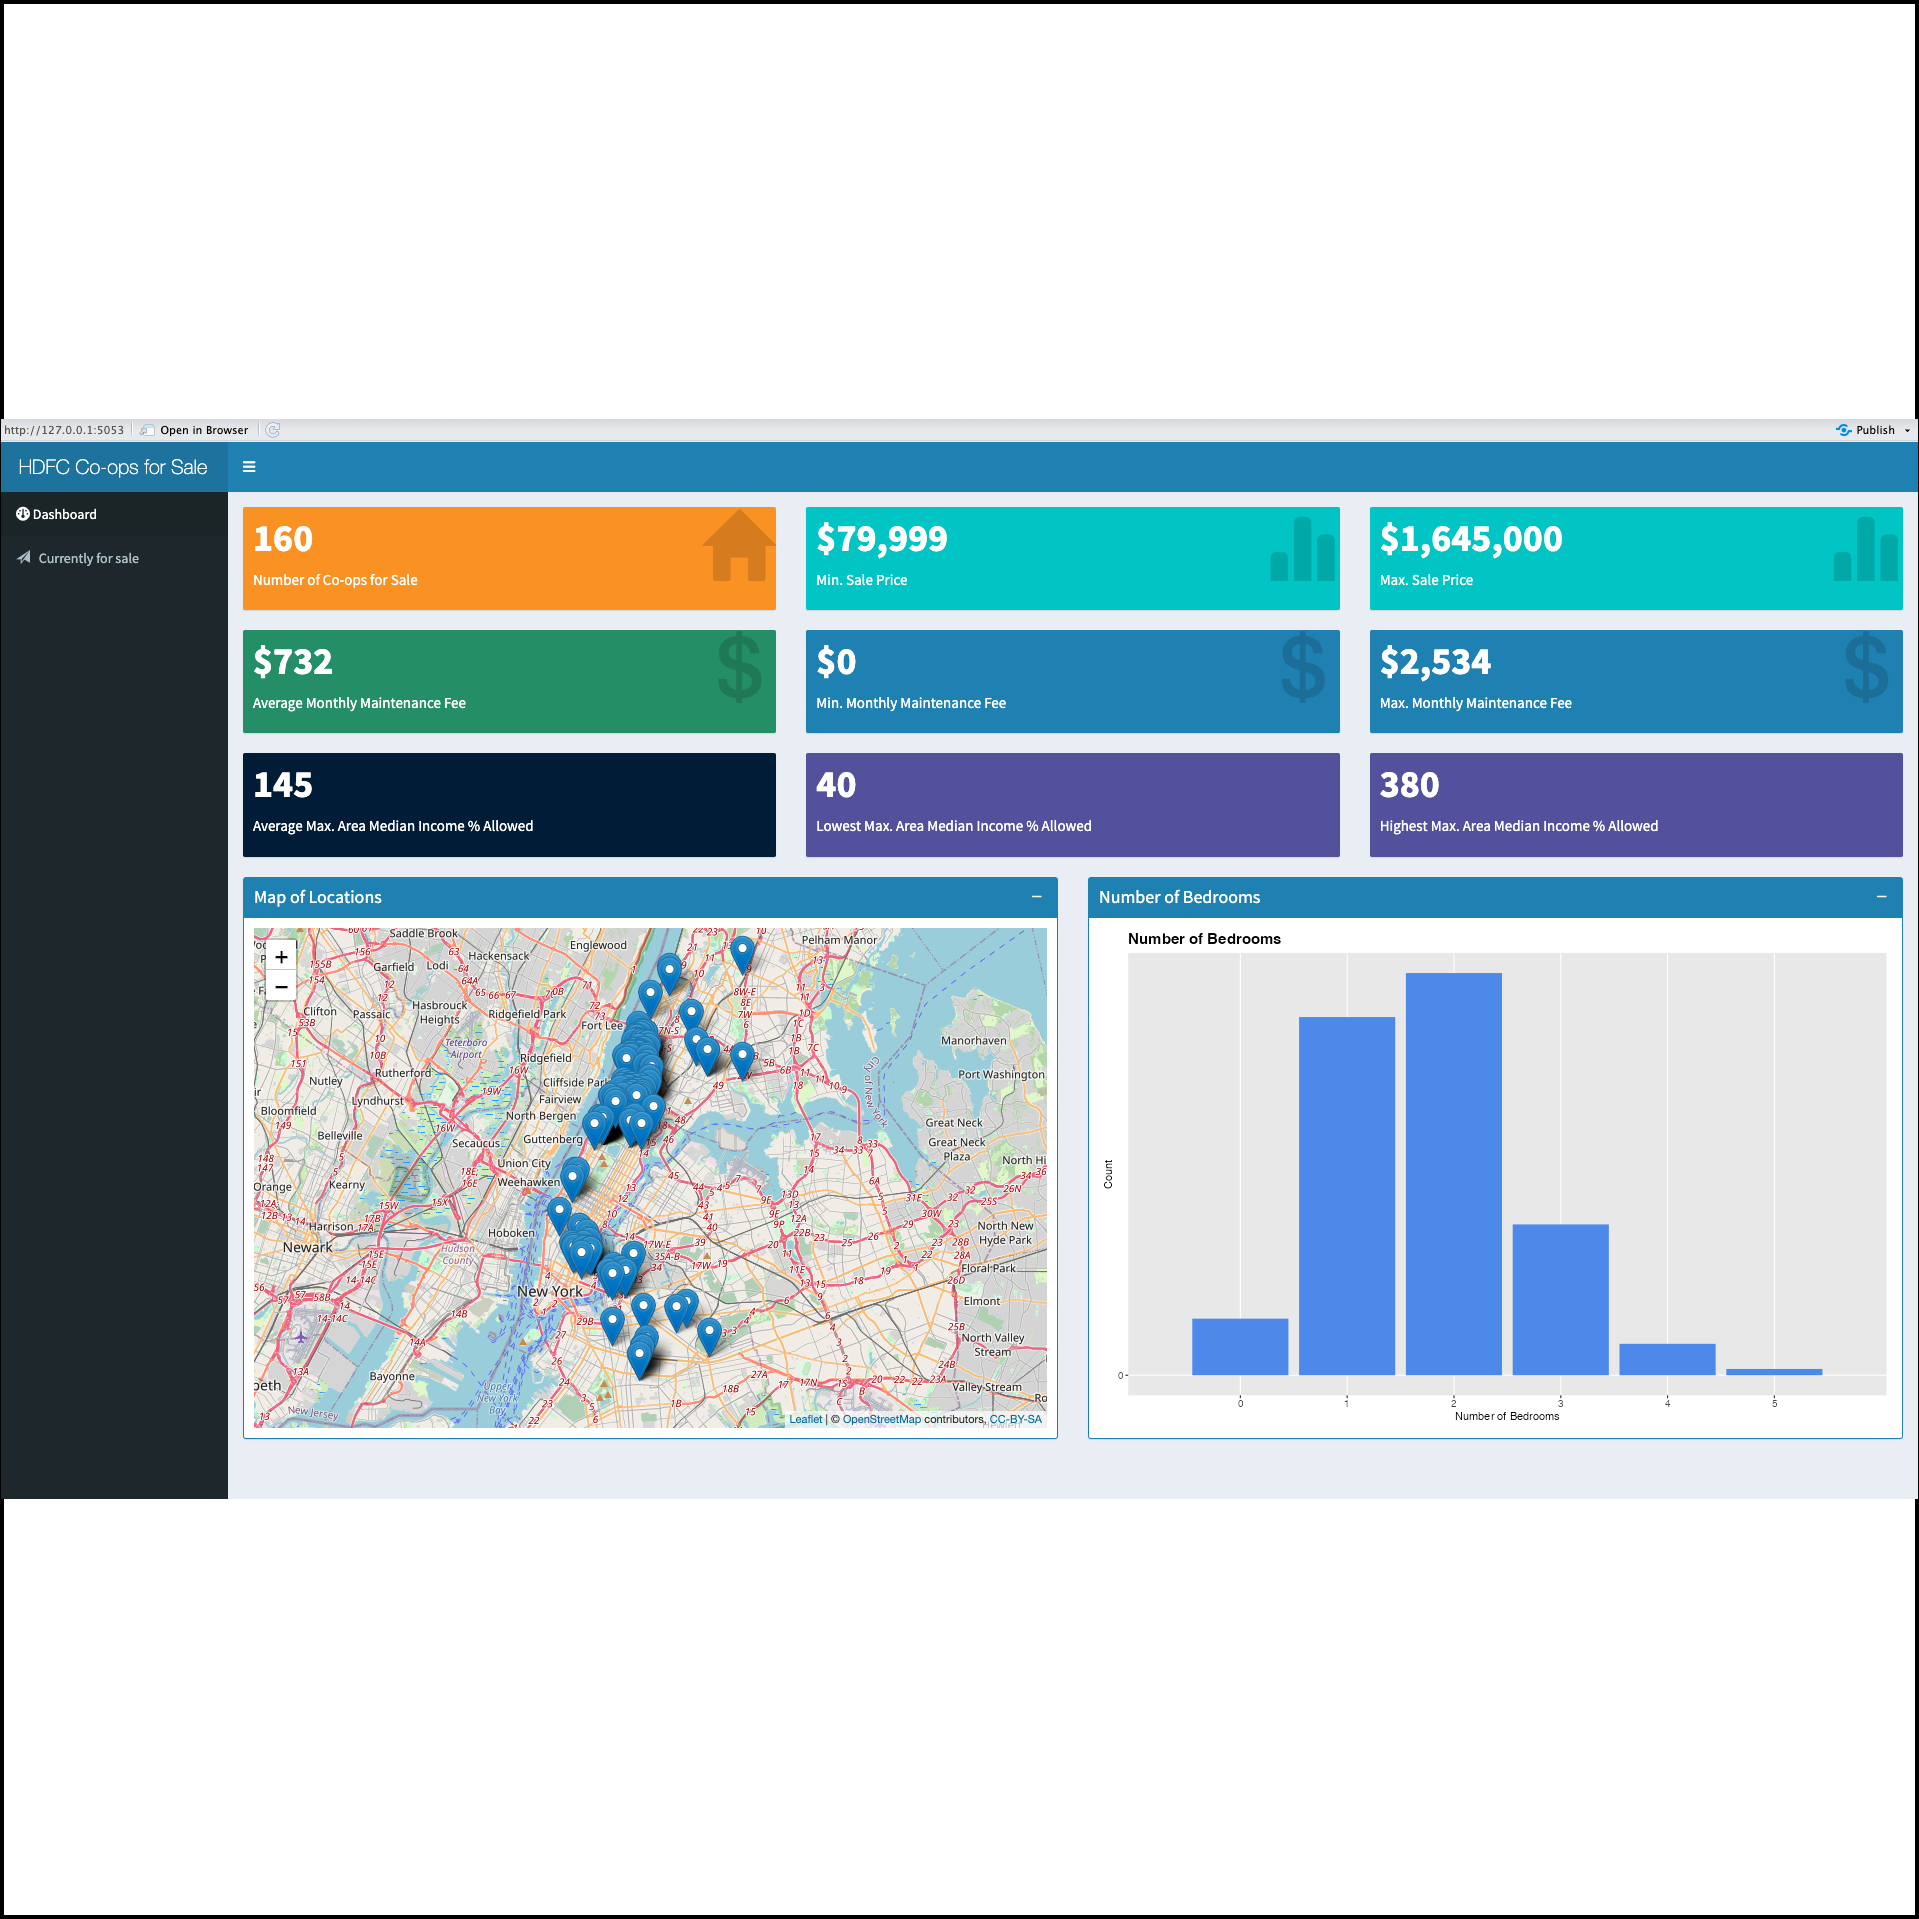
Screenshot of dashboard featuring key indicators, map with pop-ups, and a bar graph.
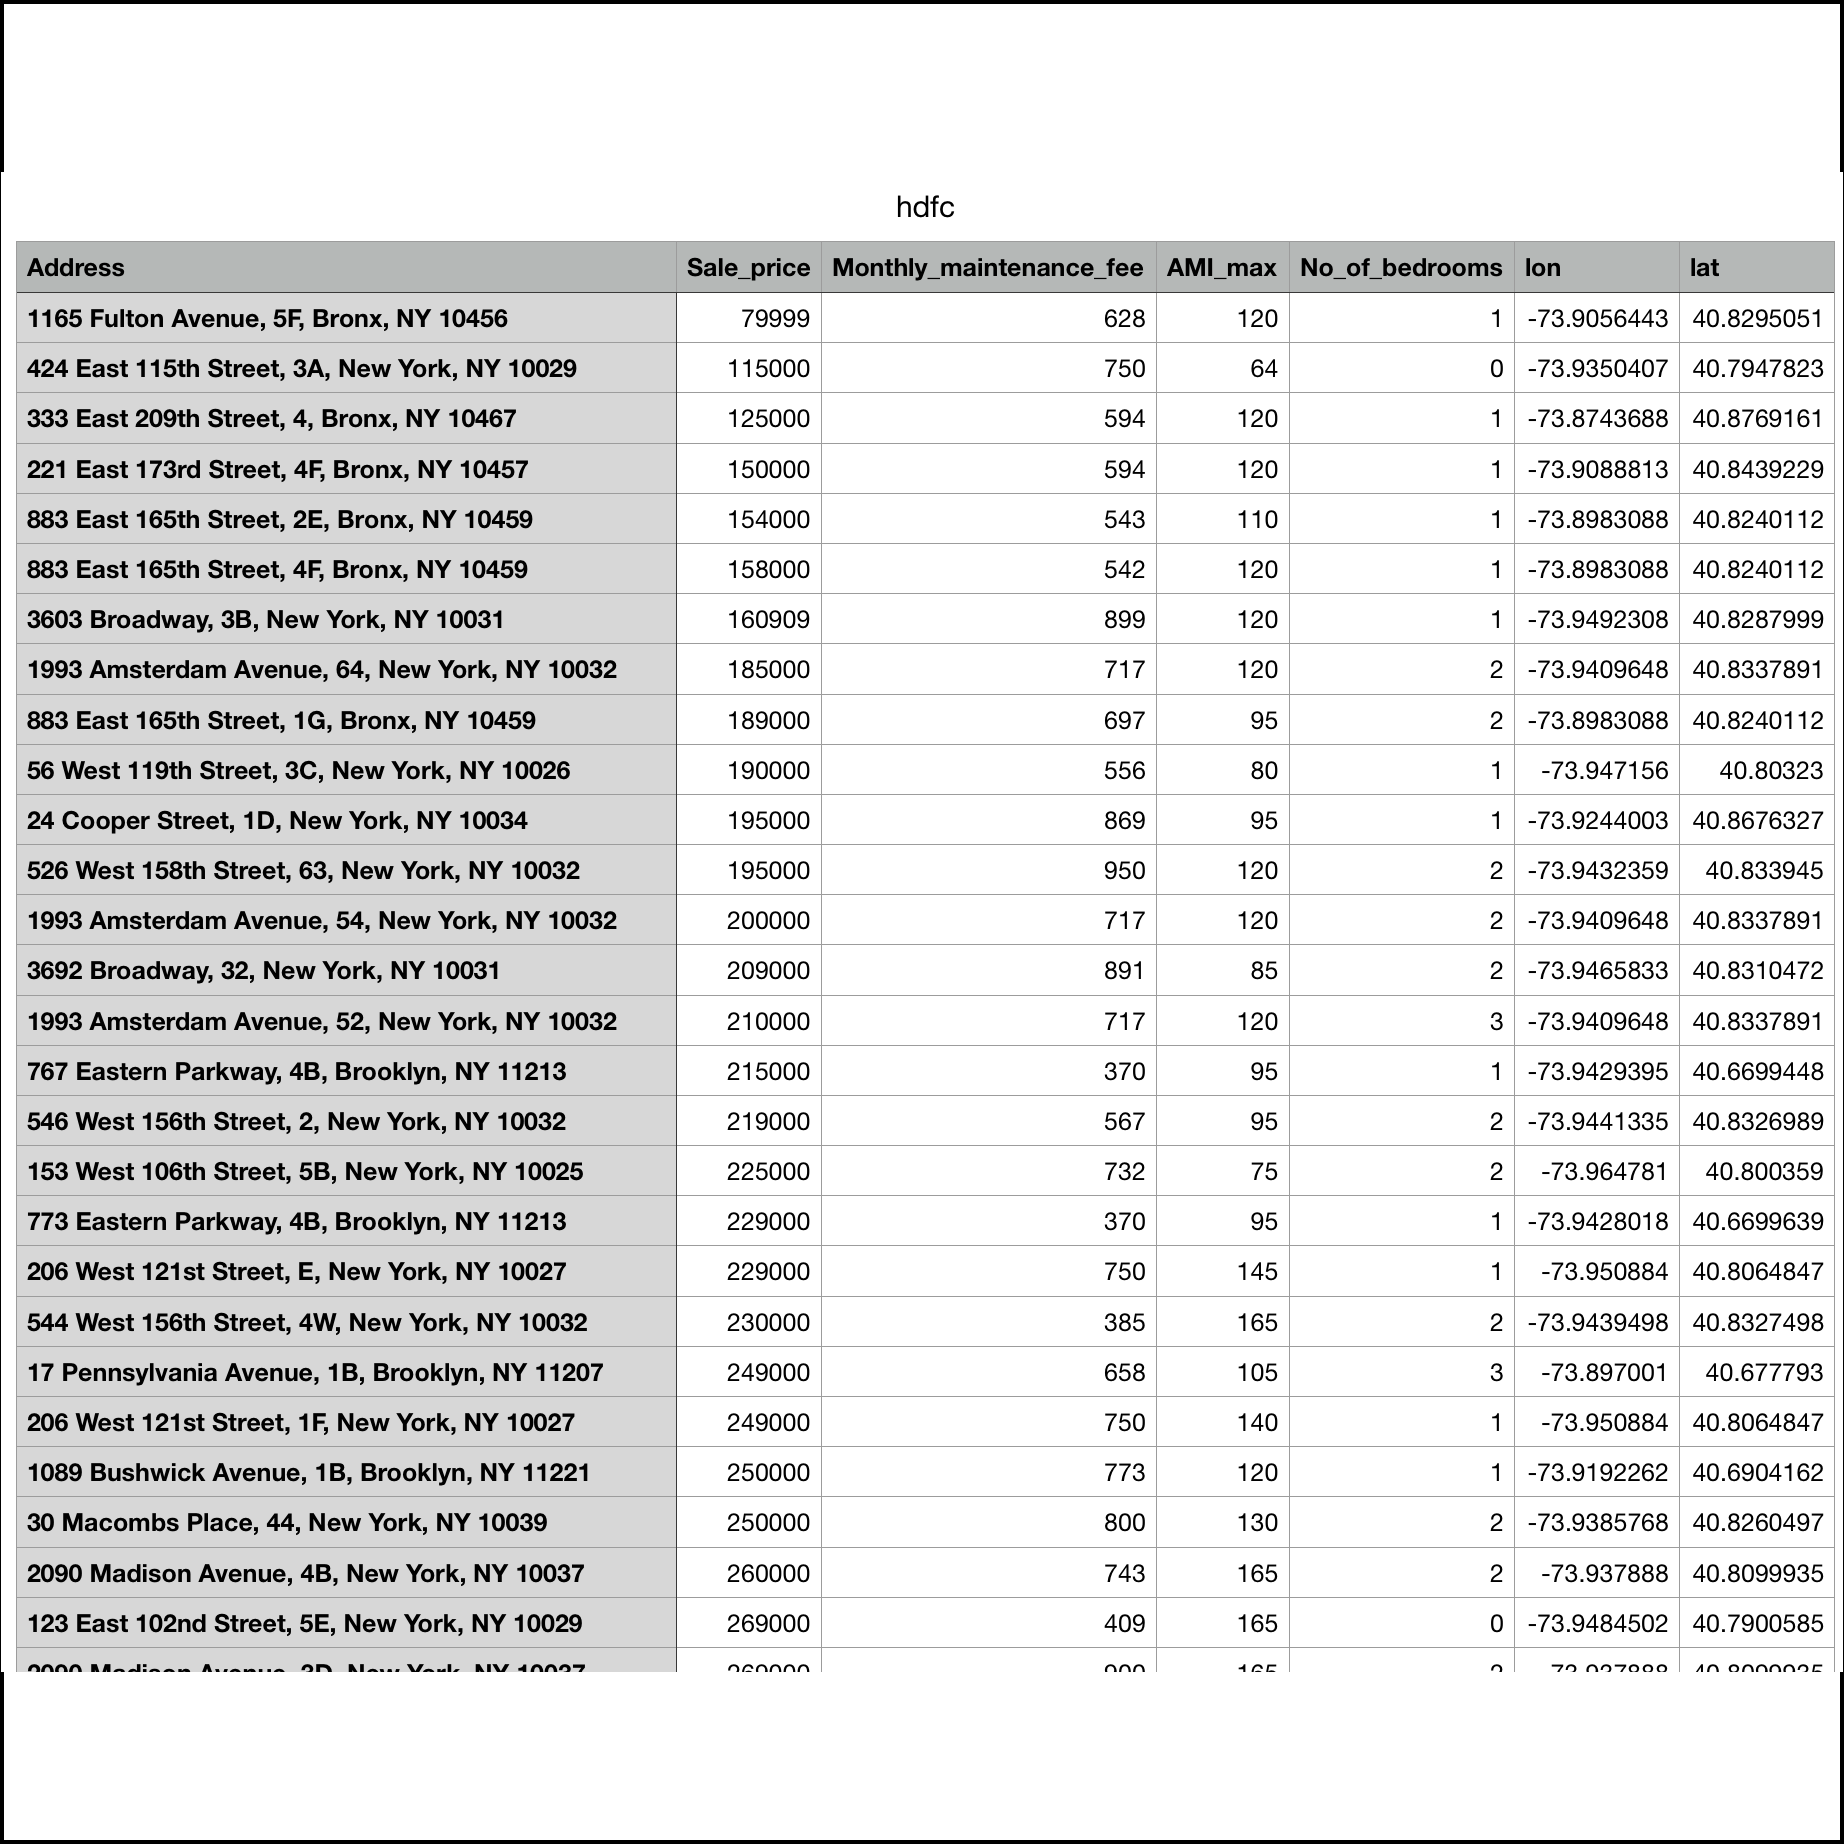
Partial view of the csv file I compiled of HDFC co-op units for sale on StreetEasy.com in March 2023.

I configured pop-ups to include each unit's important details.
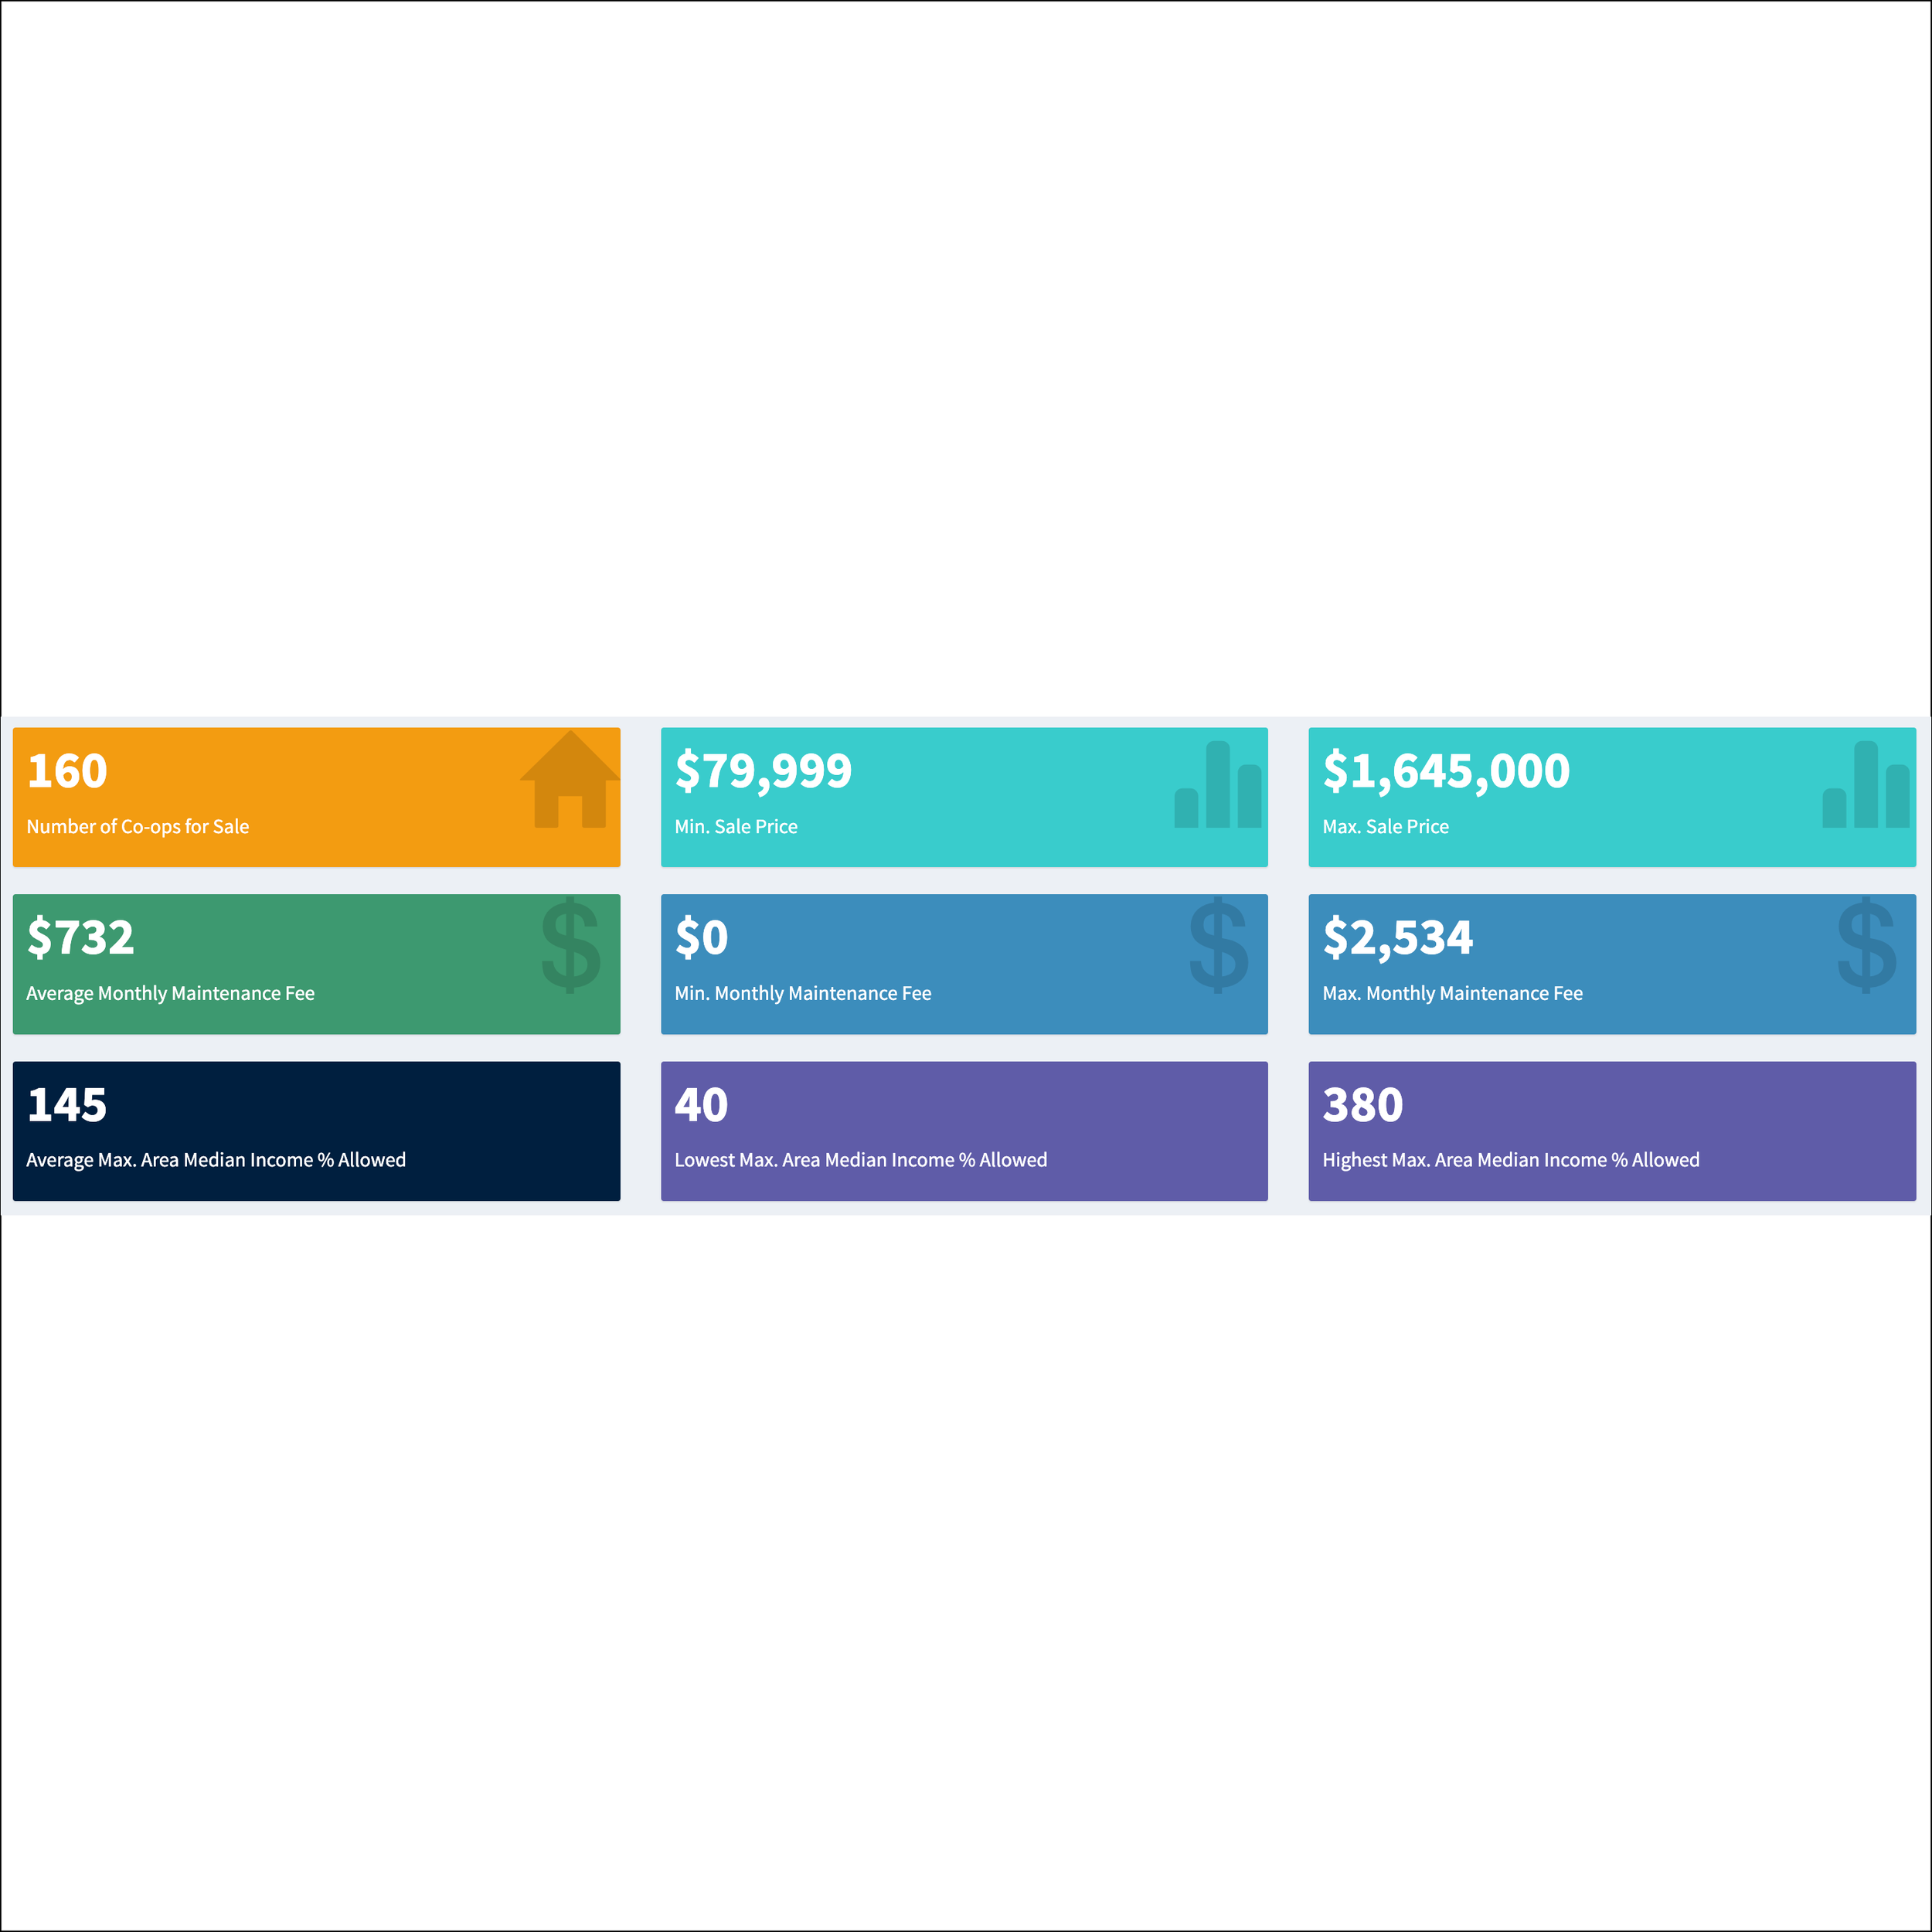
Each indicator was carefully chosen - in particular, the min. and max. value of the sales listings, monthly maintenance fees, and the max. Area Median Income allowed to qualify for purchase.
(For the README file, code, and csv file please click here.)
Executive Summary
In March 2023, I was working on a larger project about affordable housing in NYC, and as part of it, I collected all the available HDFC (Housing Development Fund Corporation) co-op unit listings on StreetEasy.com. I wanted to create a dashboard that showed a map with all the unit locations plus important details of the listings, such as minimum, maximum, and mean of particular indicators.
Tools Used
Programming language: R
Google Maps API (to geocode addresses to longitude, latitude)
Method
1) Collecting data from StreetEasy.com
First, I collected the data from streeteasy.com - where I selected the 5 boroughs under "location" as well as "income-restricted" under "more" filters - and ended up with 196 addresses.
2) Removing incomplete data
However, I knew that for each address I wanted to have the monthly maintenance fee information as well as the maximum Area Median Income (AMI) allowed for an applicant to qualify to purchase the unit, and I noticed some of the units did not list AMI or maintenance fee info. After removing these addresses, I was left with 160 addresses, which can be seen in the file hdfc.csv.
3) Geocoding addresses
Then, I used the Google Maps API to geocode the addresses, which create new "lon" and "lat" columns and added them to the dataset, which I exported as a new csv file to use for the dashboard.
4) Designing the dashboard
I decided that at the top of the dashboard, I would show what I felt were the most important details surrounding the data, including the:
total of number units
minimum and maximum sale price
average, minimum, and maximum monthly maintenance fee
average, minimum, and maximum of the max. Area Median Income (AMI) allowed for a purchaser to qualify for the unit
Then, underneath the indicators, I wanted to show a map plotting all the units, which I did using leaflet, and I configured the popups to include all the important details of each unit. To the right of the map you see a histogram concerning the number of bedrooms in this particular dataset.